By: Lucy Sledge, Meteorologist
INTRODUCTION
Weather is always a topic of discussion among neighbors. People are talking about it feels like it is getting windier … but is it actually? Wind speeds can be extremely damaging to a crop. Wind gusts from 50-80mph can cause an insurable loss on a crop, according to the PRM Claims Team. Let’s break down the numbers and find the truth if wind should be a concern in your risk management plan.
I looked at two measurements to determine if wind speeds were increasing:
- The average daily wind speed. This tells us if the “baseline” of wind is getting stronger. If every day gets windier, we see this in the average daily wind speed.
- Peak daily wind gust. This can tell us more about the most extreme wind gusts a city/region is experiencing day over day, year over year.
I used the National Climate Prediction Center data from the last 30 years. To have complete datasets (99%+ complete), I selected established weather reporting sites across these states – typically airports or weather service offices with installed, automated anemometers to record wind speeds and gusts. Some stations’ wind data availability started later than 1994 and is noted in the individual sections.
For average daily wind speeds, I’ve used graphs to visualize any trends over the last 30 years and if the average daily wind speed is increasing or decreasing.
When analyzing the strongest wind gusts, I measured two criteria: 50 mph and 70 mph. The 50 mph wind gusts are when we see impacts on crops. The 70 mph wind speed classifies a storm as “destructive” for crops and property. Of note, reliable wind data comes from single reporting cities, and this data will not account for the 70+ mph wind gusts seen with severe thunderstorms/wind storms or blizzards elsewhere across the states. Still, with three to five stations over the last three decades, wind strength and frequency trends can be determined.
NORTH DAKOTA
North Dakota has seen a large increase in the peak wind gusts in the previous ten years. Every city saw an increase in the average number of days per year with wind gusts over 50 mph, to now 5-6 more days per year in the last decade.

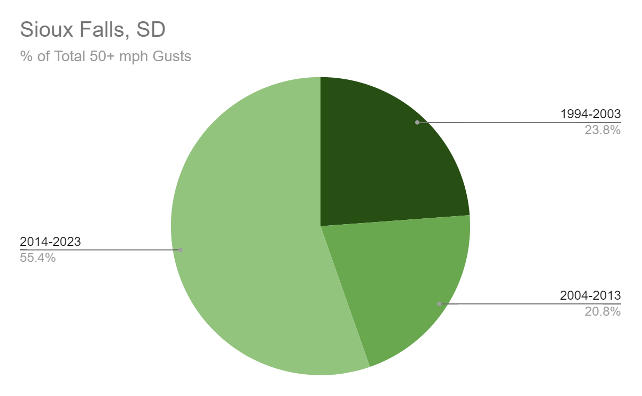
Bismarck has seen 53% of its strongest wind gusts in the last decade, If there was no increasing trend, we anticipate each decade slice to account for 33.3% of the pie. There is an increasing frequency of days with damaging wind gusts in North Dakota.

For Jamestown and Minot, all of our 70+ mph wind gusts occurred within the last ten years, with four and three, respectively. Grand Forks saw four of the five recorded 70+ mph wind gusts in the previous ten years. There may be a trend here of peak winds getting to extreme levels, but the frequency of events is approximately once every 2.5-3 years.
I compared the average daily wind speed trend to the average peak wind gust speed in the graph below. There has been a slight decrease in average daily wind speed over the last 25 years in Jamestown. This trend is mirrored in all other cities. There is an increase in the strength of our peak gusts in the previous 30 years, in addition to the frequency of strong wind gusts over 50 mph.
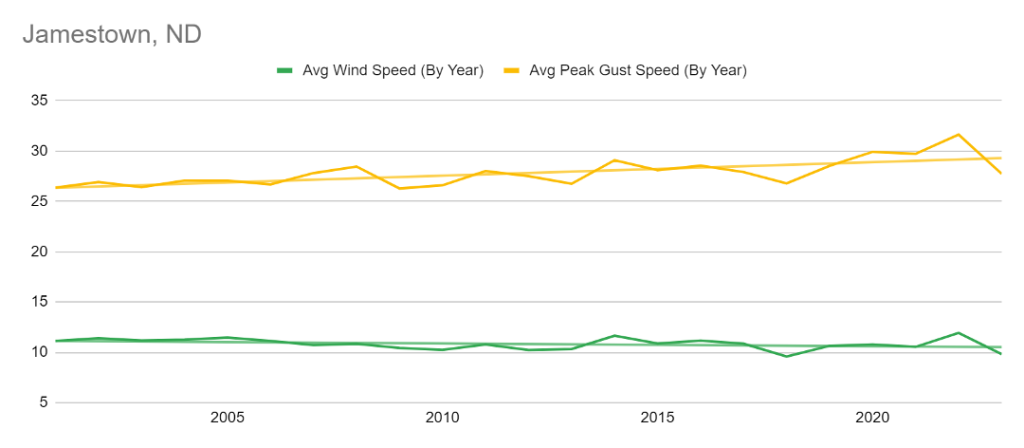
Each city in North Dakota saw a decrease in daily average wind speed of 0.5-1 mph except Grand Forks, which saw a slight increase from 10 mph to 10.5 mph over the last 30 years. There has been no notable change to the average daily wind speed in North Dakota.

SOUTH DAKOTA
Rapid City now sees, on average, 12 more days a year with peak winds of 50+ mph compared to the previous 10-year period and over 20 more peak wind days compared to 1993-2003. Pierre, Sioux Falls, and Watertown also saw dramatic increases from 2004-2013 to 2014-2023, each of roughly six more days with peak gusts over 50 mph.

In Sioux Falls, the last decade accounts for more than half the 50+ mph peak days (if there were no upward trend, we would expect it to be only 33.3%).
I compared the average daily wind speed trend to the average peak wind gust speed in the graph below. Rapid City has seen no change in average daily wind speed, but there has been an increase in peak gust speed year over year. Rapid City is windier due to its proximity to the Black Hills, which results in downsloping wind events—many of our strongest wind gust days (70+ mph) occurred in the late fall through early Spring. Of the 38 days with recorded gusts over 70 mph in Rapid City, 66% happened in the last ten years, for an average of two days per year. Not only are we seeing a higher frequency of strong wind gusts, but our daily wind gusts are also getting stronger.
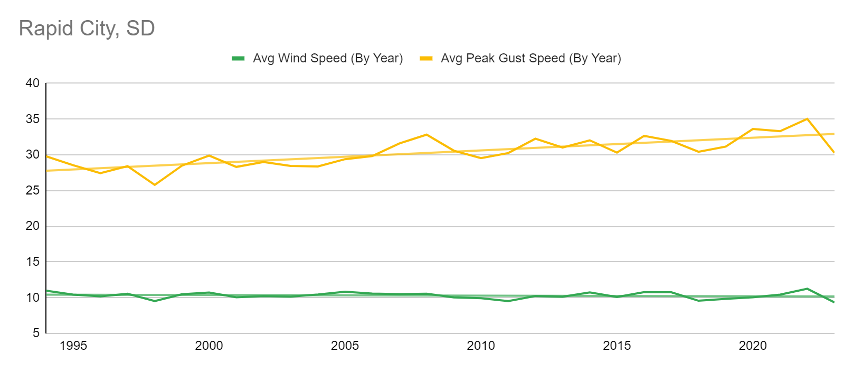
I took data from four cities in South Dakota: Rapid City, Pierre, Sioux Falls, and Watertown. Over the last 30 years, Rapid City and Pierre saw no significant changes in average daily wind speed, while Sioux Falls and Watertown saw slight decreases.

MISSOURI
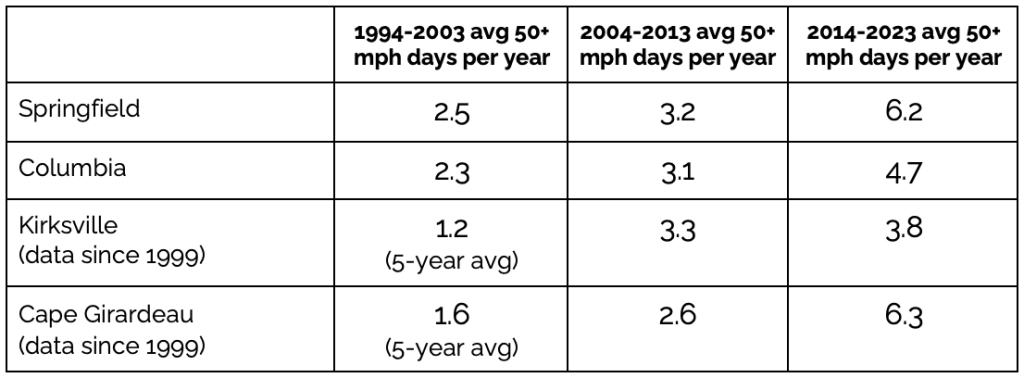
Following the trend of other cities in the report, we have seen a significant increase in the frequency of 50+ mph days in Missouri. Most notably, in Springfield, the number of days with peak gusts over 50 mph has nearly doubled in the last ten years. In Cape Girardeau, also in the southern tier of the state, we saw 2.5 times more 50+ mph days per year since 2014 than between 2004 and 2013.
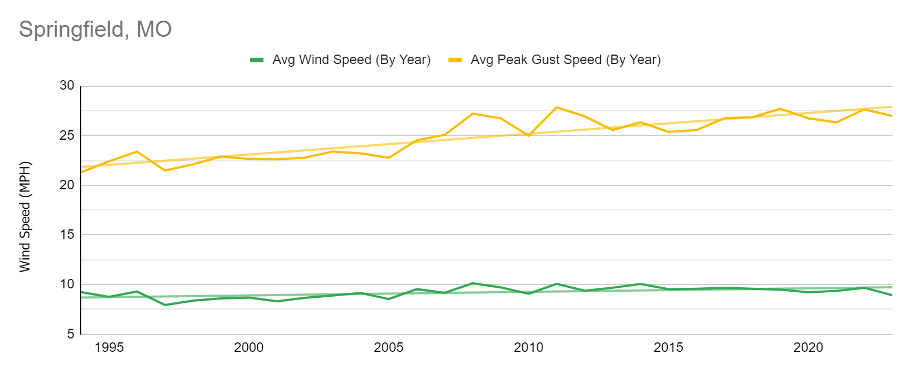
In the graph below, I compared the average daily wind speed trend to the average peak wind gust speed. In Springfield, MO, there has been a slight increase in average daily wind speed in the last three decades. However, more importantly, it shows an increase in average peak wind gust speed. We have seen an increased frequency of strongest wind gusts (50+ mph) and a steady increase in peak wind gust speed.
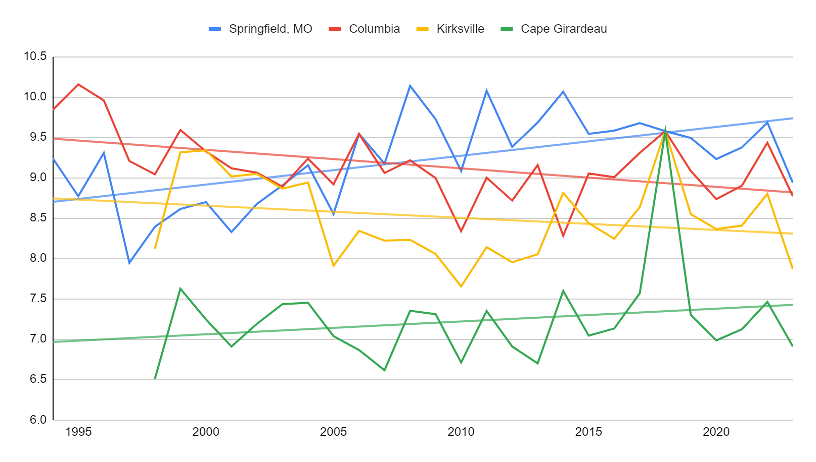
When we look at the trend of average wind speeds in the previous 30 years, there are decreases in average daily wind speed in Columbia and Kirksville, each of about ½ mph. Alternatively, Cape Girardeau and Springfield saw increases in their average daily wind speeds of ½ mph and 1 mph, respectively. There is no statewide trend for wind, but geographically, there could be a slight decrease in daily wind speeds in the northern tier of the state. This is also supported by data from Illinois cities (found below).
IOWA
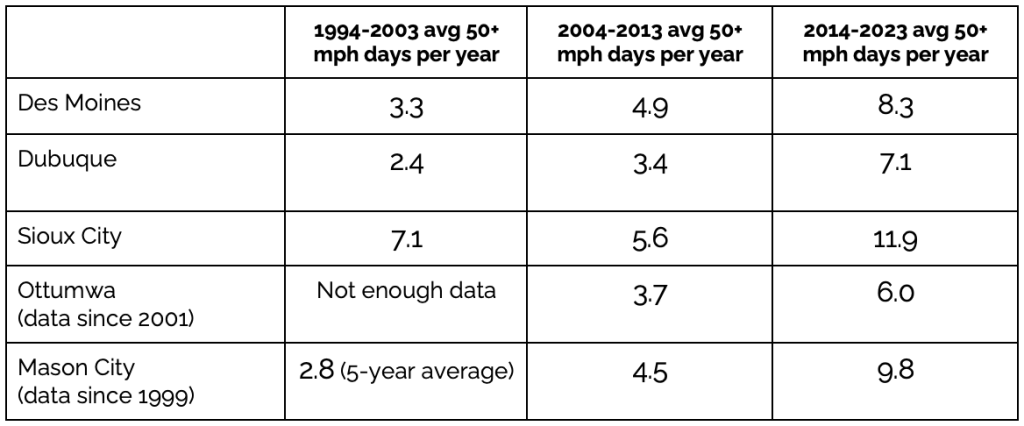
Looking at the average number of days with a peak gust at or above 50 mph in both Des Moines and Sioux City shows an interesting trend from the 1994-2003 years to 2004-2013 years … a decrease in the amount of 50+ mph peak wind gust days. However, for the decrease we saw in the middle years, we have seen and increase in the last decade with, on average, three more days per year with gusts of 50+ mph. Sioux City, Dubuque, and Mason City have seen the most dramatic increases over the last 20 years, with their average number of days per year of 50+ mph doubling from 2004-2013 to the previous ten years.
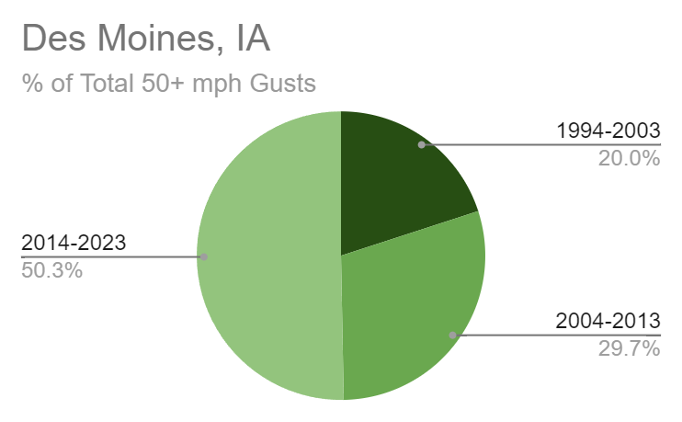
Des Moines has seen more than 50% of its 50+ mph wind gusts in the last decade – if there were no trend, we would expect this number to be 33.3%.
When we plot both the average daily wind speed and the average peak wind gust speed over the last 30 years, we can see little to no change in average daily wind speed but a notable increase in the average peak wind gust speed from roughly 23 mph to 28 mph. This increasing trend is also seen in Des Moines and Sioux City. The frequency of peak wind gust days and strength of daily wind gusts have increased.

Sioux Falls’ average daily wind speed has decreased from 10.5 mph to 9.8 mph. Mason City has had a slight decrease (less than 1/3 mph), with no noticeable trend in average daily wind speed in Des Moines, Dubuque, or Ottumwa.

NEBRASKA
There has been a significant increase in the frequency of peak gusts of 50+ mph across Nebraska. We have seen 5-6 more days per year in the last decade compared to the 2003-2014. Over the last 30 years, North Platte has measured 70+ mph 18 times, 14 of which have been in the previous decade. A similar trend has been seen in Hastings, with 74% of our 70+ mph recorded wind gusts occurring in the last ten years. When we break it down a little further, there have been five 70+ mph wind gusts since 2019, and only one occurred in winter, making all of these gusts severe weather-related. The frequency and strength of peak wind gusts are increasing.

Over the last 30 years, Hastings and Norfolk have seen little to no change in the average daily wind speed, a decrease of less than ½ mph. There is a small downward trend in North Platte, from the average daily wind speed of ~9.3 mph to ~8.5 mph (graph with trend line below).

MINNESOTA
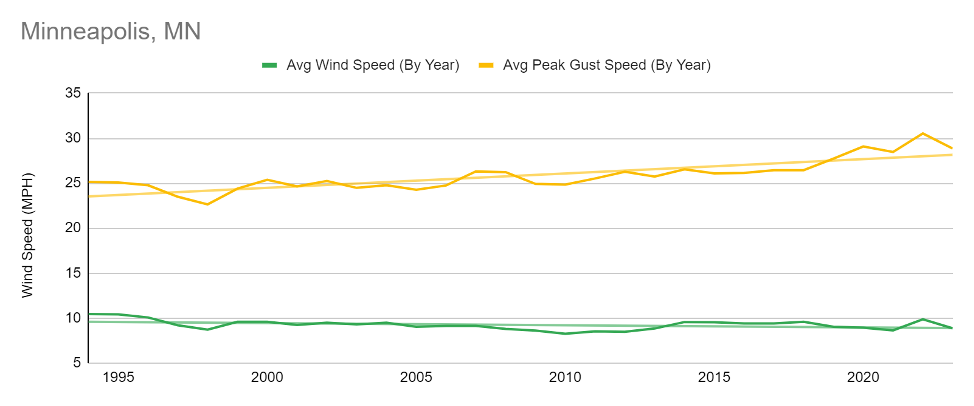
On average, our Minnesota cities see roughly 1-2 more days a year with wind gusts over 50 mph compared to 30 years ago. The vast majority of our 50+ mph wind reports for these cities have been in the last ten years, with Brainard and Hibbing seeing double or three times as many 50+ mph wind days in the last ten years as they had in the previous 20. Notably, concerning severe wind, there have been no 70+ mph gusts measured in Minneapolis. We know the general area has seen severe winds this strength or greater, but not measured at a frequency to determine trends in occurrence.

Looking at the trend of wind gusts versus average daily wind,, we can see hardly any change in Minneapolis’s average daily wind, but there is a visible increase in the strength of peak wind gust speeds. The strength and frequency of our peak gusts are increasing.
ILLINOIS
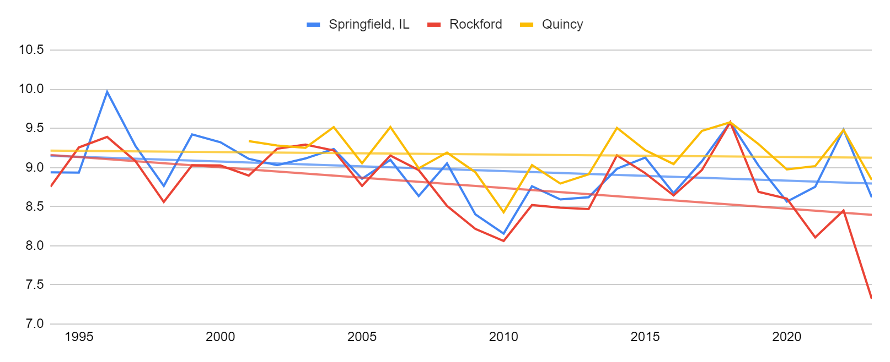
There has been an increase in the frequency of strong wind reports across all cities in the last decade. In Springfield, the city saw nearly double the 50+ mph days in the most recent 10-year period compared to 2004-2013, but only an average of one more 50+ mph peak day compared to 1994-2003. In Rockford, there were nearly double the amount of 50+ mph days from 2014-2023 compared to 2004-2013 and 2.5x more compared to the 1994-2003 period. There is an increasing frequency of peak wind gusts over 50 mph.

The cities analyzed are in northern and central Illinois, and all saw slight decreases in average daily wind speed over the last 30 years. Geographically, these cities are aligned with north Missouri and central-southern Iowa, where latitudes in similar places saw either small decreases or no changes in average daily wind speeds.
CONCLUSION
So … has it actually been getting windier? Yes and no.
There have been minor (less than ½ mph) changes to average daily wind speeds on the day-to-day timeline. Some cities that included more significant changes (1 mph) were Springfield, IL, which increased slightly, and North Platte, NE, and Ottumwa, IA, which both decreased.
The more notable impacts from wind are more frequent gusts at or above 50 mph per year. Every single city has seen MORE days per year with 50+ mph wind gusts compared to 30 years ago. Not only do we see an increase in the frequency of strong wind gusts, but we are also seeing an increase in the speed of peak wind gusts in the last 30 years. For example, in 1994, we may have seen an average wind gust speed of 25 mph, but in 2023, it is now 30 mph. The “baseline” for wind gusts have been rising. Many cities, except Nebraska and South Dakota, saw fewer than ten 70+ mph wind gusts over the last 30 years. The most extreme wind gusts are generally rare, occurring once every 5-8 years.
As mentioned in the introduction, these cities were chosen due to the availability of historical weather data, but only account for small areas of each state. Severe storms and wind storms have brought more localized wind impacts. Still, this data shows a general trend of increasing frequency of intense wind days (50+ mph) and average strength of peak wind gusts.
If wind is a concern for you in your area, you should talk with a Precision Risk Management Advisor about your risk management options. Contact them today.
Precision Risk Management is an equal opportunity provider. This is not a recommendation of any products or services. Talk to a Risk Management Advisor for any recommendations. Go to PrecisionRiskManagement.com/legal for all disclosures.


