by Nick Paulson and Gary Schnitkey, Department of Agricultural and Consumer Economics, University of Illinois,
Bradley Zwilling, Illinois FBFM Association and Department of Agricultural and Consumer Economics, University of Illinois and Carl Zulauf, Department of Agricultural, Environmental and Development Economics,
Ohio State University
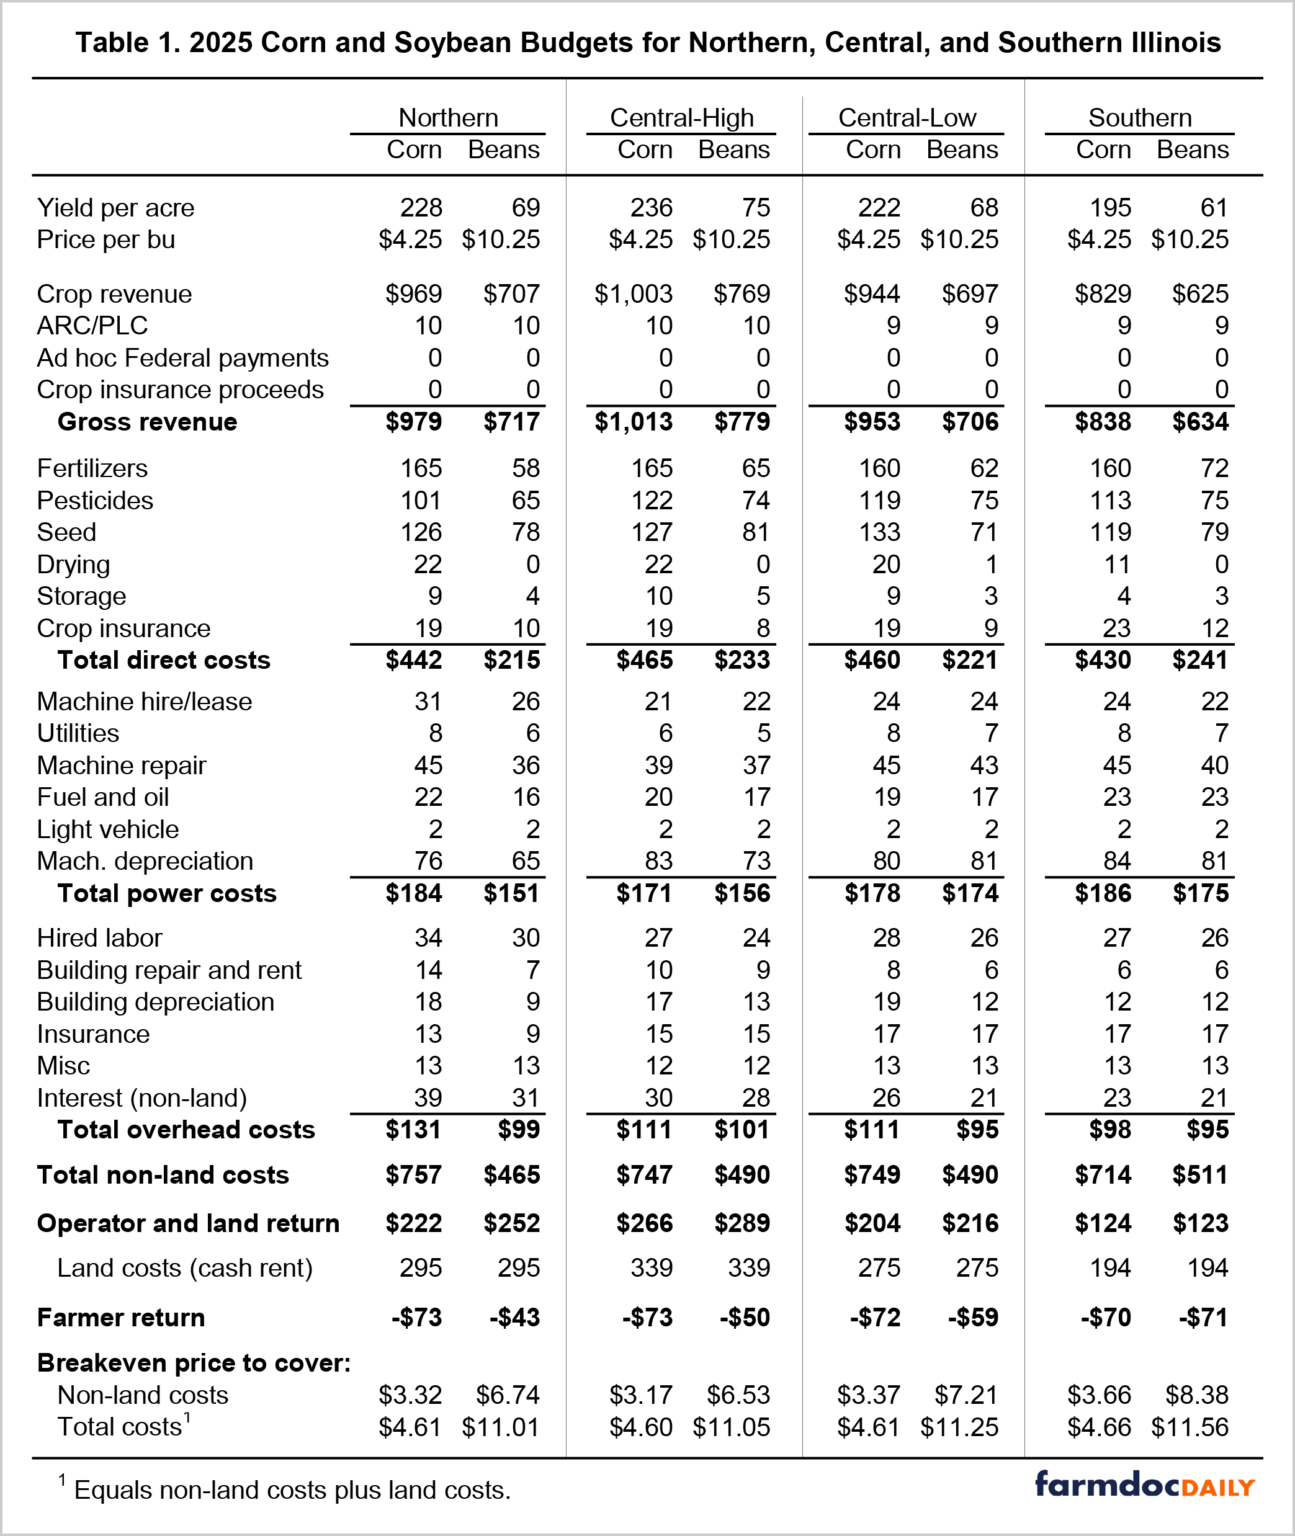
Illinois crop budgets for 2025 are now available HERE in the Management section of the farmdoc website. Overall, projections are for lower production costs for corn and soybeans in 2025 compared with 2024. Projected cost reductions primarily come from lower fertilizer and fuel costs. Break-even prices to cover all costs, including cash rent for farmland, range from $4.60 to $4.66 per bushel for corn and $11.01 to $11.56 per bushel for soybeans. Despite lower cost projections, current expectations for corn and soybean prices suggest negative farmer returns to corn and soybeans across all regions of Illinois in 2025.
2025 Crop Budgets
Crop budgets are prepared for three regions of Illinois: northern, central, and southern (see Table 1). Central Illinois budgets are further broken out for high- and low-productivity farmland in the region. Over the past 5 years (2019-2023), corn yields on high-productivity land in central Illinois have averaged 222 bushels per acre, while yields on low-productivity land has averaged 208 bushels per acre.
The farm records from Illinois Farm Business Farm Management (FBFM) provide historical data for the 2025 projections. Summaries of FBFM records are available from 2018 to 2023 in a farmdoc publication entitled Revenue and Costs for Illinois Grain Crops. The budget projections provided in table 1 are informed by the historical summaries as follows:
1. Projected yields are based on historical linear trends fit to each region from 2000 to 2023. Trend yield projections for corn in 2025 are 228 bushels per acre in northern Illinois, 236 (high-productivity) and 222 (low-productivity) in central Illinois, and 195 in southern Illinois. Trend soybeans yields are 69 bushels per acre in northern Illinois, 75 (high-productivity) and 68 (low-productivity) in central Illinois, and 61 in southern Illinois.
2. Corn and soybean price projections are for an average market year price received by farmers in Illinois. They are based on current futures prices on Chicago Mercantile Exchange (CME) contracts that would be used to market the 2025 crop and the latest USDA projections for national 2025 market year average prices.
3. Projected 2025 costs are based on 2023 costs (the most current year for which FBFM summaries exist), 2024 cost projections, available information on input price changes, and expectations for costs over the following year.
Given projected price levels for 2025, revenues include crop revenues and a relatively small ARC/PLC payment. Crop insurance and ad hoc programs could provide additional payments for 2025. Insurance indemnities would require price or yield losses relative to guarantees that will reflect relevant price and yield expectations when they are determined, and ad hoc support would require congressional or administrative action.
Total non-land costs include:
*Direct costs include crop inputs such as fertilizers, pesticides, seed, drying, storage, and crop insurance premiums. These costs will vary with input prices, crop planted, and conditions experienced throughout the growing season.
*Power costs are associated with machinery and power: machinery hire, utilities, machinery repair, fuel and oil, light vehicle, and machinery depreciation. Machinery depreciation is based on an economic life of ten years (for most equipment), assumes no salvage value, and will differ from tax depreciation (does not include any accelerated depreciation).
*Overhead costs include hired labor, building repair and rent, building depreciation, insurance, miscellaneous, and interest on non-land costs.
Operator and land return equals gross revenue minus non-land costs, representing the return to both farmer and land. Subtracting out a land cost results in net farmer return. The Illinois crop budgets include an average cash rent value, which varies by region, as a measure of land costs.
Projected farmer returns are negative for corn and soybeans across all regions of Illinois for 2025 (see Table 1). Farmer return projections for corn range from -$70 to -$73 per acre. Farmer return projections for soybeans range from -$43 to -$71 per acre for soybeans.
Estimated break-even prices to cover non-land and total costs are provided by region at the bottom of table 1. Break-even corn prices to cover non-land costs range from $3.17 to $3.66 per bushel; break-even corn prices increase to $4.60 to $4.66 per bushel for all costs. Break-even soybean prices to cover non-land costs range from $6.53 to $8.38 per bushel; break-even soybean prices increase to $11.01 to $11.56 per bushel for all costs.
Recent Returns
Table 2 compares the 2025 budgets to 2023 actual results and current expectations for 2024 returns for high-productivity land in central Illinois. Negative returns occurred for both corn and soybeans in 2023 as non-land costs reached historic highs and corn and soybean prices were lower than for the 2021 and 2022 crop years (see farmdoc daily from September 20, 2024). Cost reductions are projected for 2024, mainly due to lower fertilizer prices. However, continued low prices imply negative returns for 2024 even with lower costs and exceptional yields expected in Illinois.
To read the entire report click here.


