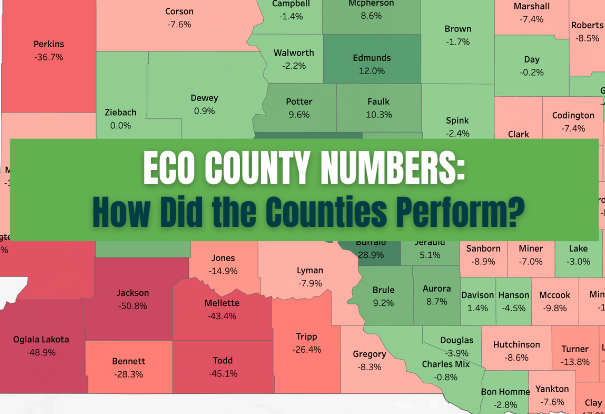
See How Your County Performed
The Risk Management Agency (RMA) has released the final county yields and revenues that determine how Enhanced Coverage Option (ECO) performed for crop year 2024. Because ECO relies on collected production data after harvest, there is always a short lag before final numbers are published. PRM has compiled these figures into maps to help you understand how ECO generally performed in your area with county yields and revenues.
Jump to: South Dakota Maps | North Dakota Maps | Iowa Maps | Illinois Maps | Minnesota Maps
How ECO Works
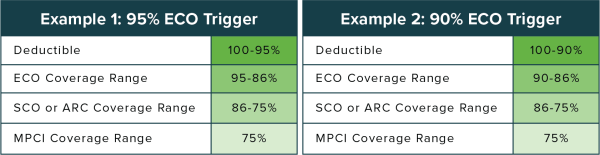
ECO is an area-based policy option that protects against drops in county-level yields or commodity price. A loss payment for ECO will be owed when the actual county revenue falls below the county revenue guarantee. This guarantee is determined by the expected county yield and the expected commodity price. If your county’s actual revenue falls below your selected coverage level, 90–95%, an indemnity may be triggered automatically.
How Prices Impacted Revenues
Revenue coverage depends not just on yields, but also on the price at harvest. For 2024, both corn and soybean prices came in lower than the projected price established during the Price Discovery Period in the spring:
• Corn: Projected price was $4.66 with harvest price at $4.16
• Soybeans: Projected price was $11.55 with harvest price at $10.03
About These Maps
The maps illustrate this concept using Illinois corn and soybean data for specific practices. They show the percentage difference between expected and actual county yields and revenues.
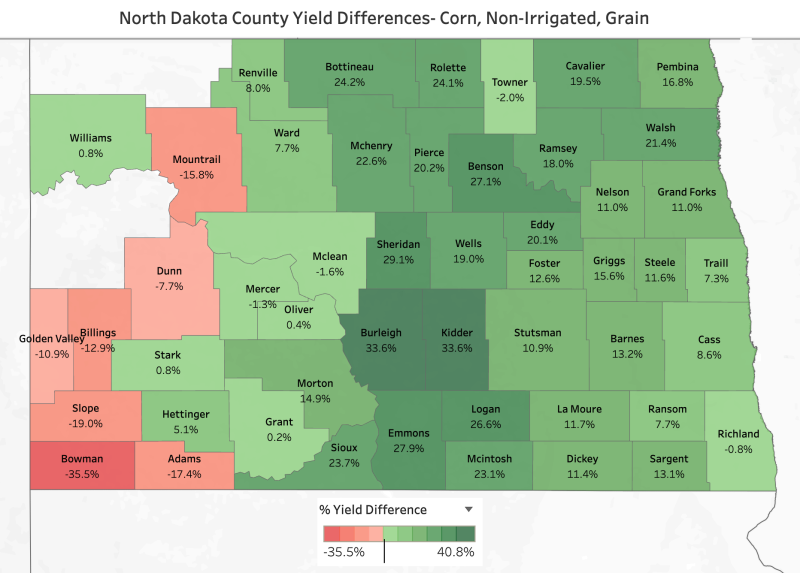
The color scale is set at a -5% difference, aligning with the highest ECO coverage level (95%) for illustration only. Counties in red experienced a yield or revenue drop greater than 5% below expectations, while green shows results closer to or above expected levels.
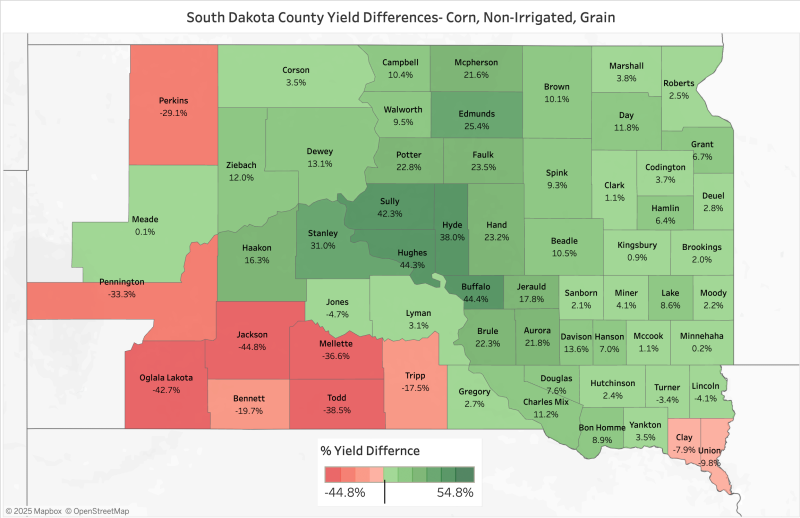
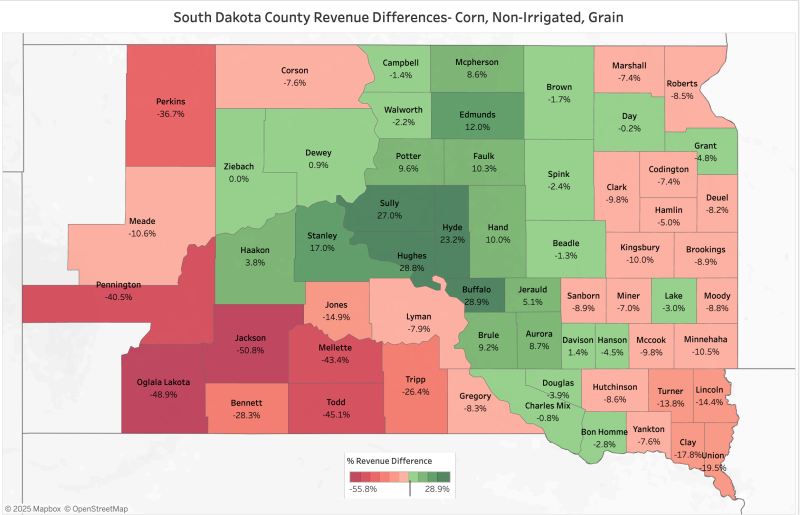
South Dakota: Corn
South Dakota: Soybeans
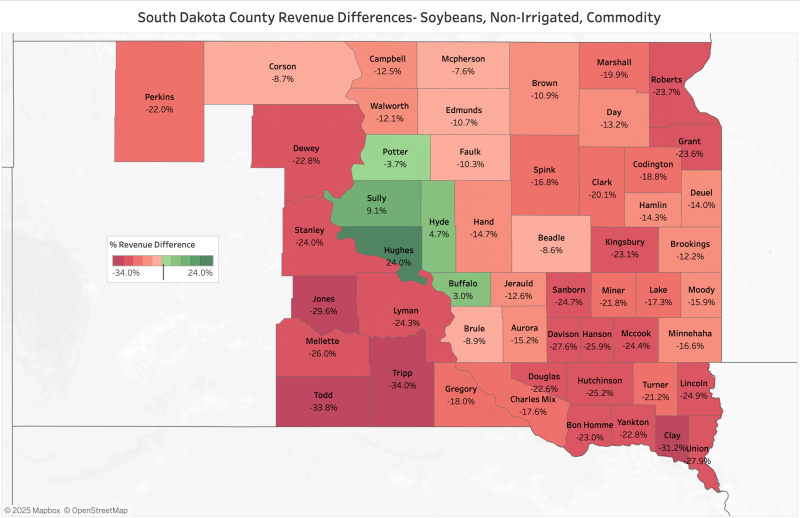
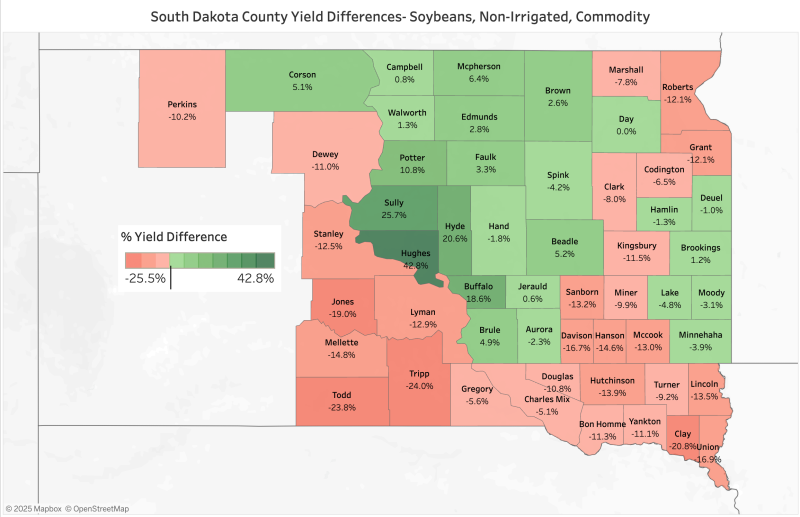
Western and southern counties generally saw larger yield and revenue shortfalls for both corn and soybeans, while parts of central and north-central South Dakota showed stronger-than-expected results in many areas.
North Dakota: Corn
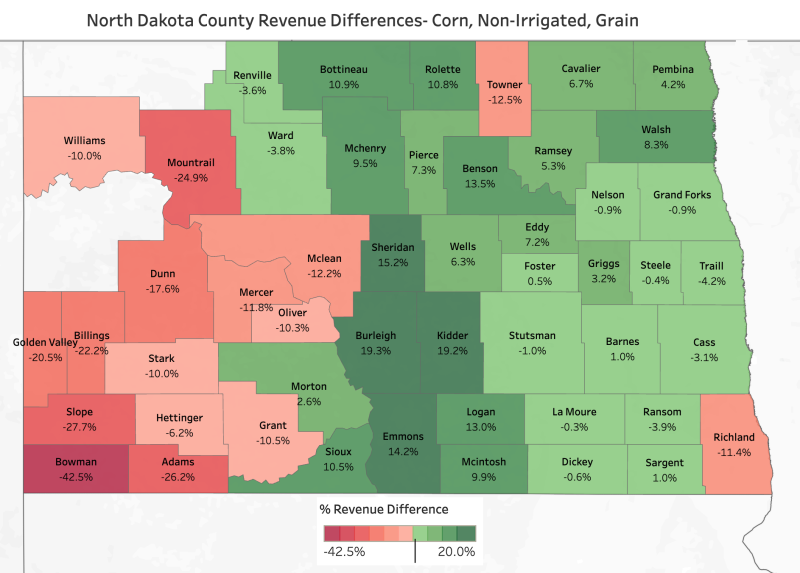
North Dakota: Soybeans
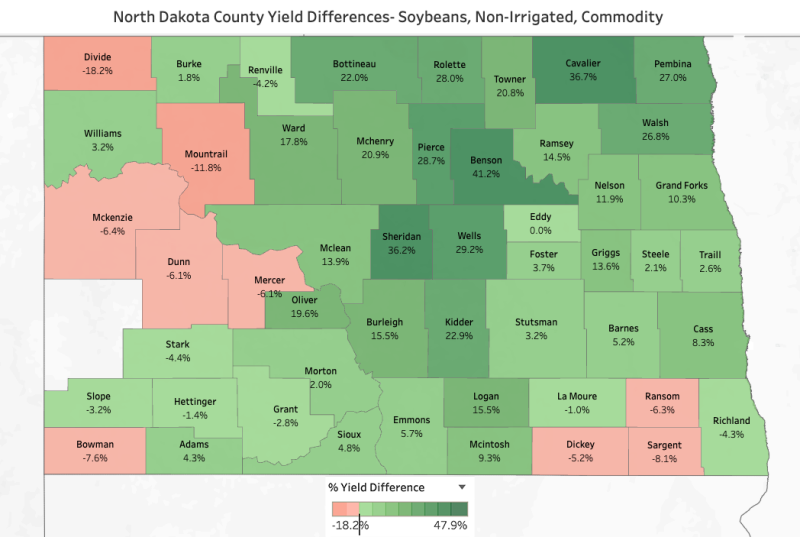
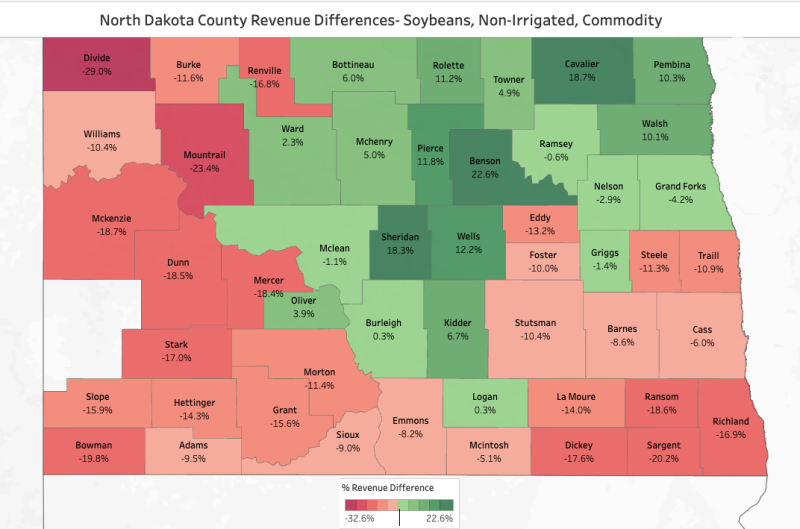
Western and southwestern North Dakota generally saw larger revenue and yield shortfalls, especially for corn. In contrast, central and northeastern counties performed well above expectations, with many areas showing strong yields and solid revenues for both crops.
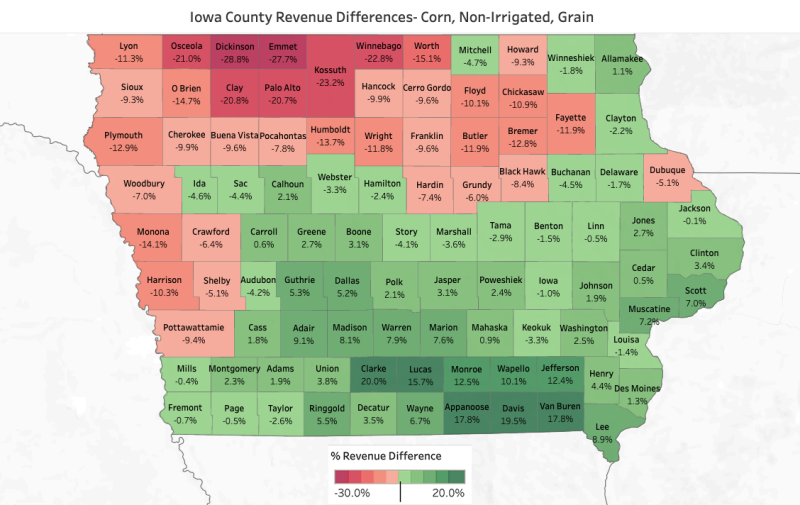
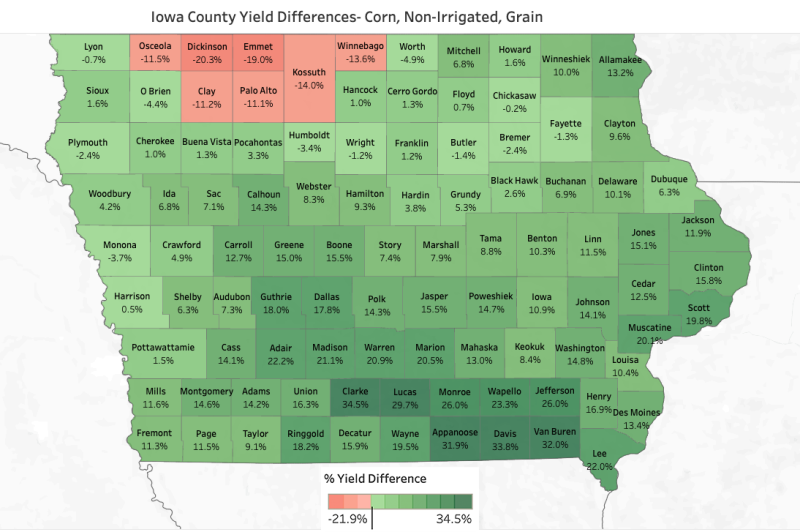
Iowa: Corn
Iowa: Soybeans
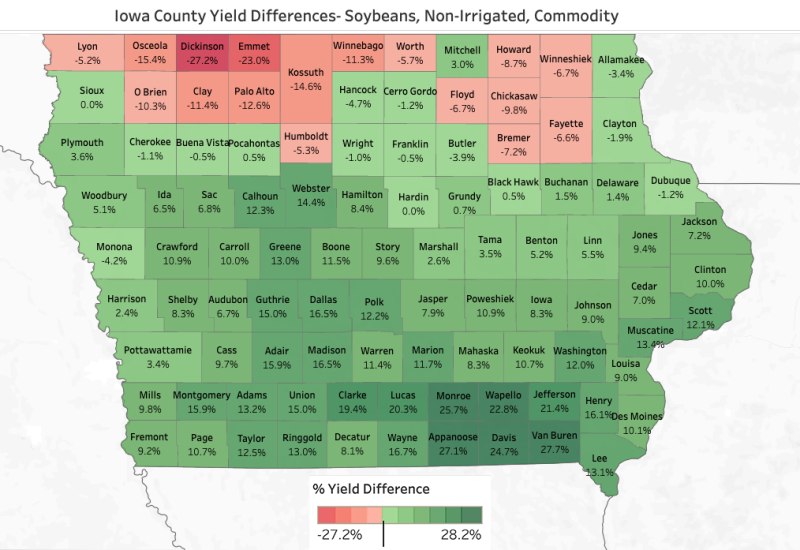
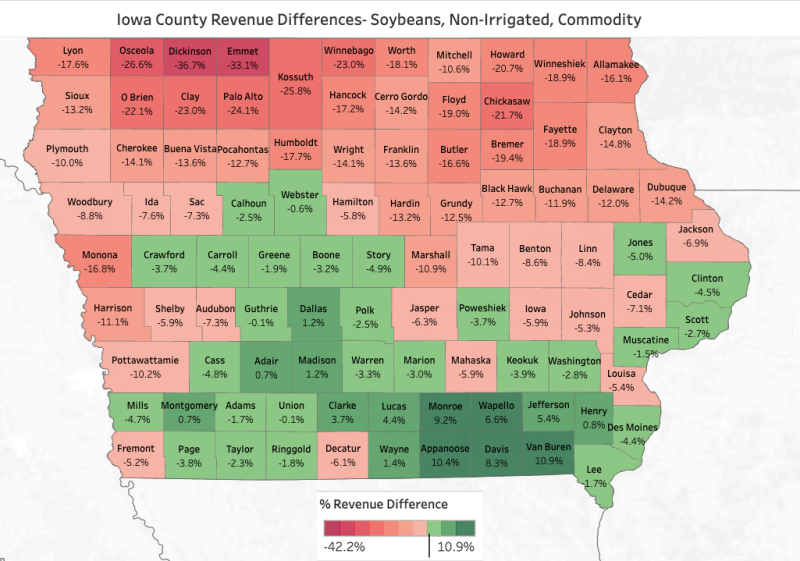
For Iowa, the maps show that northern and northwestern counties experienced notable shortfalls in both corn and soybean revenues, driven by below-average yields and lower prices. Meanwhile, central and southern Iowa generally saw stronger yields that helped offset price drops, keeping revenues near or above expectations in many areas.
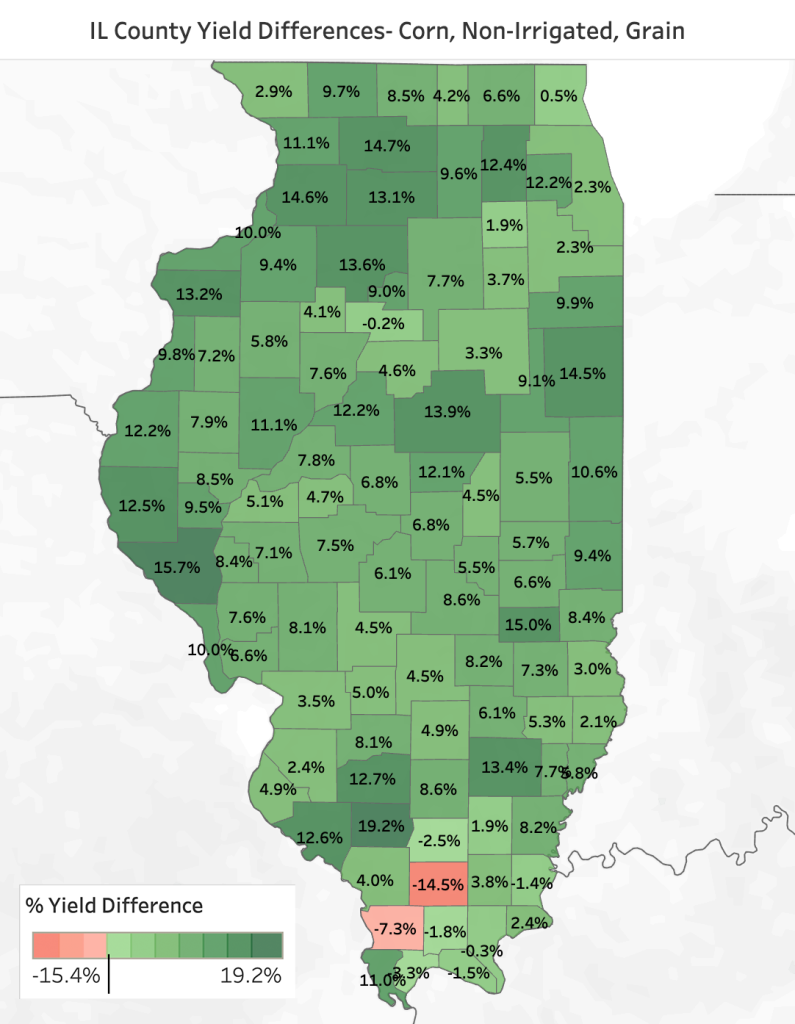
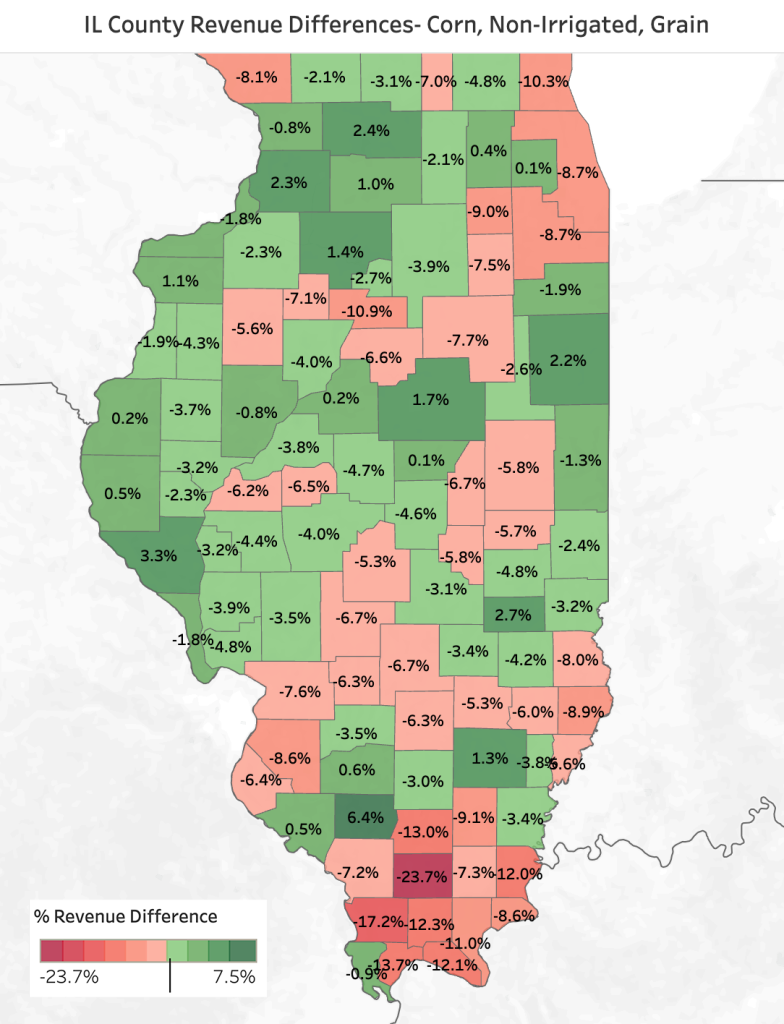
Illinois: Corn
Illinois: Soybeans

For Illinois, the maps show generally strong corn yields across most counties, keeping corn revenues steady to slightly lower in some areas, with the southern counties seeing the biggest revenue dips. In contrast, soybean revenues dropped significantly statewide despite mostly decent yields, due to lower prices and some localized yield issues in the far north and south.
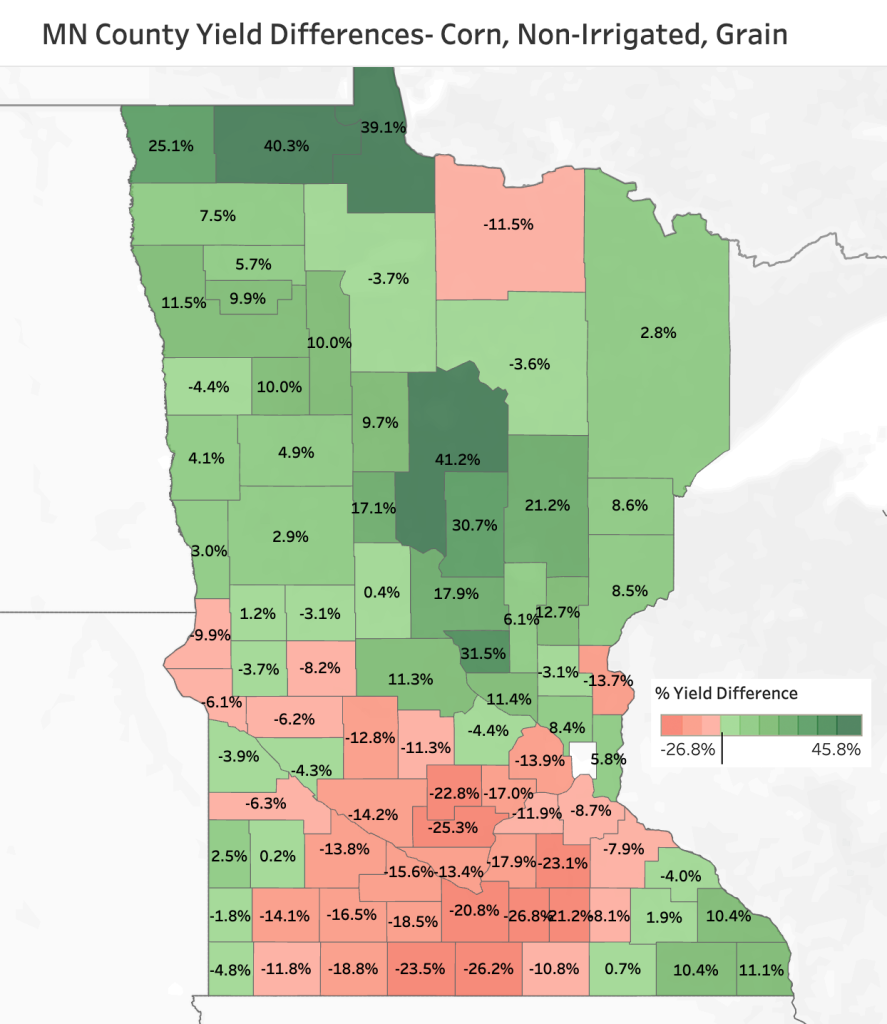
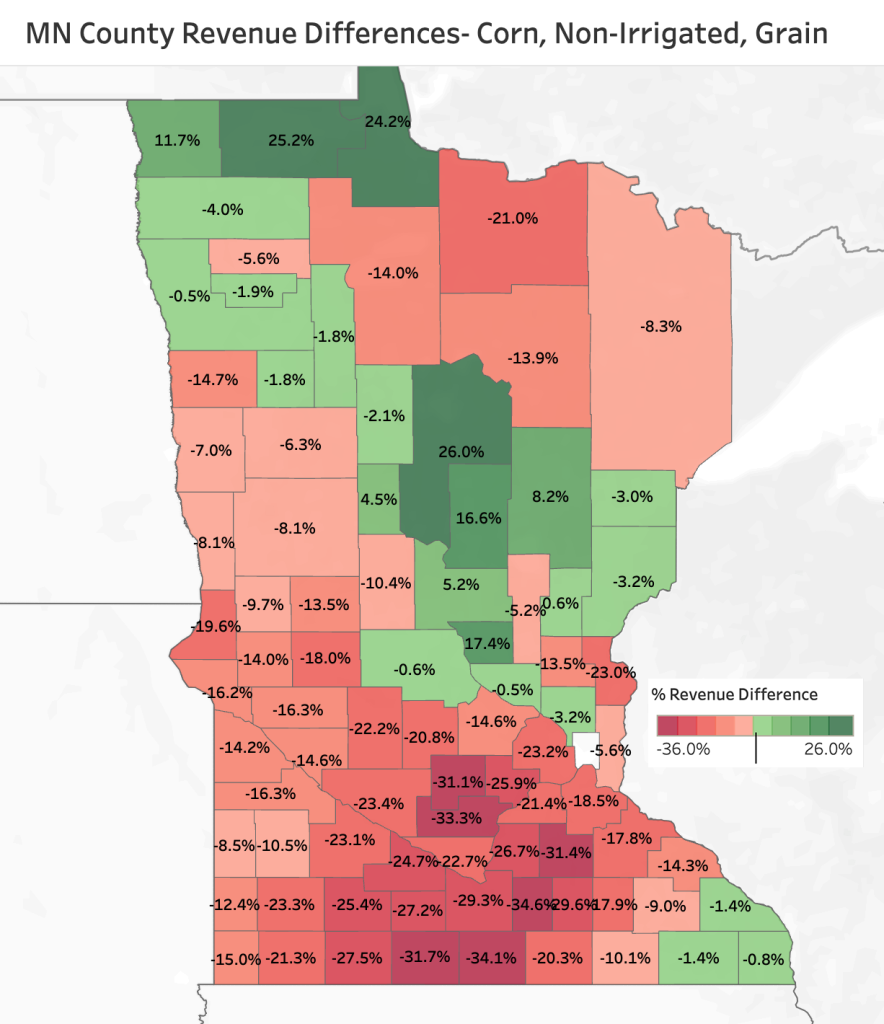
Minnesota: Corn
Minnesota: Soybeans
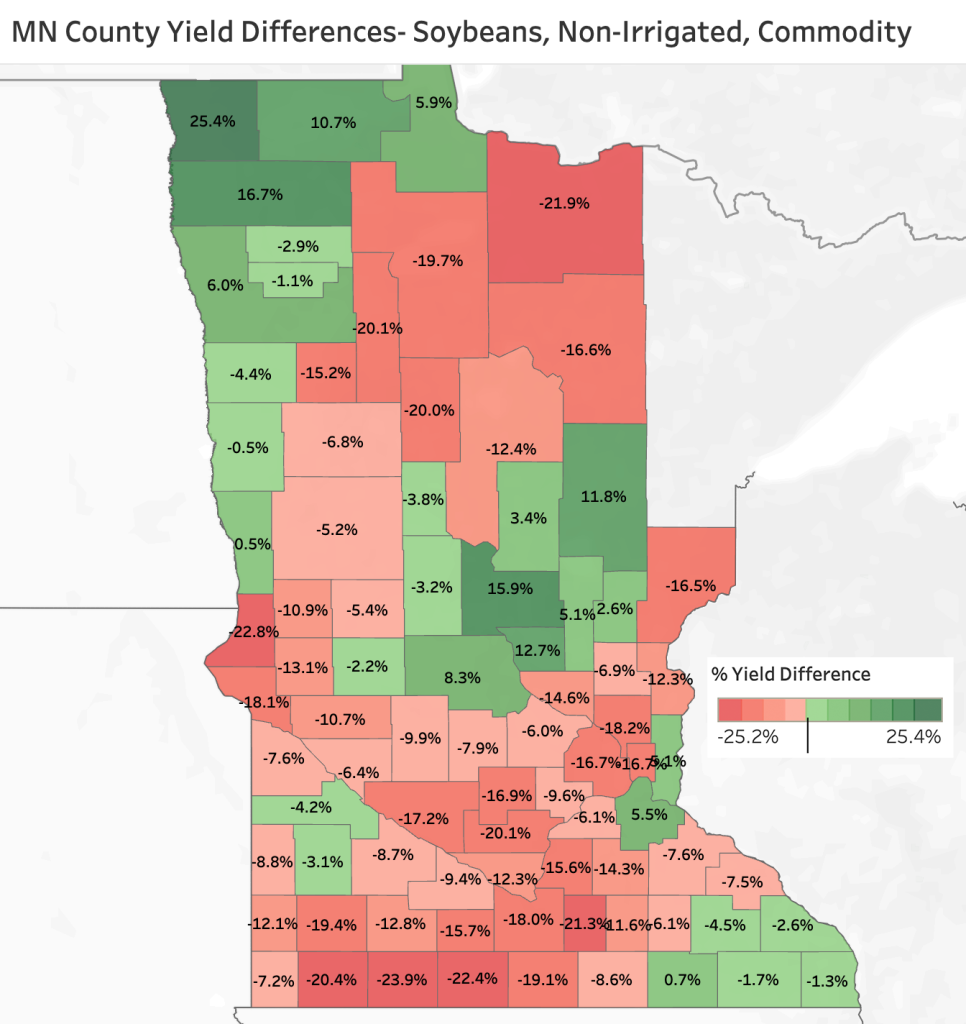
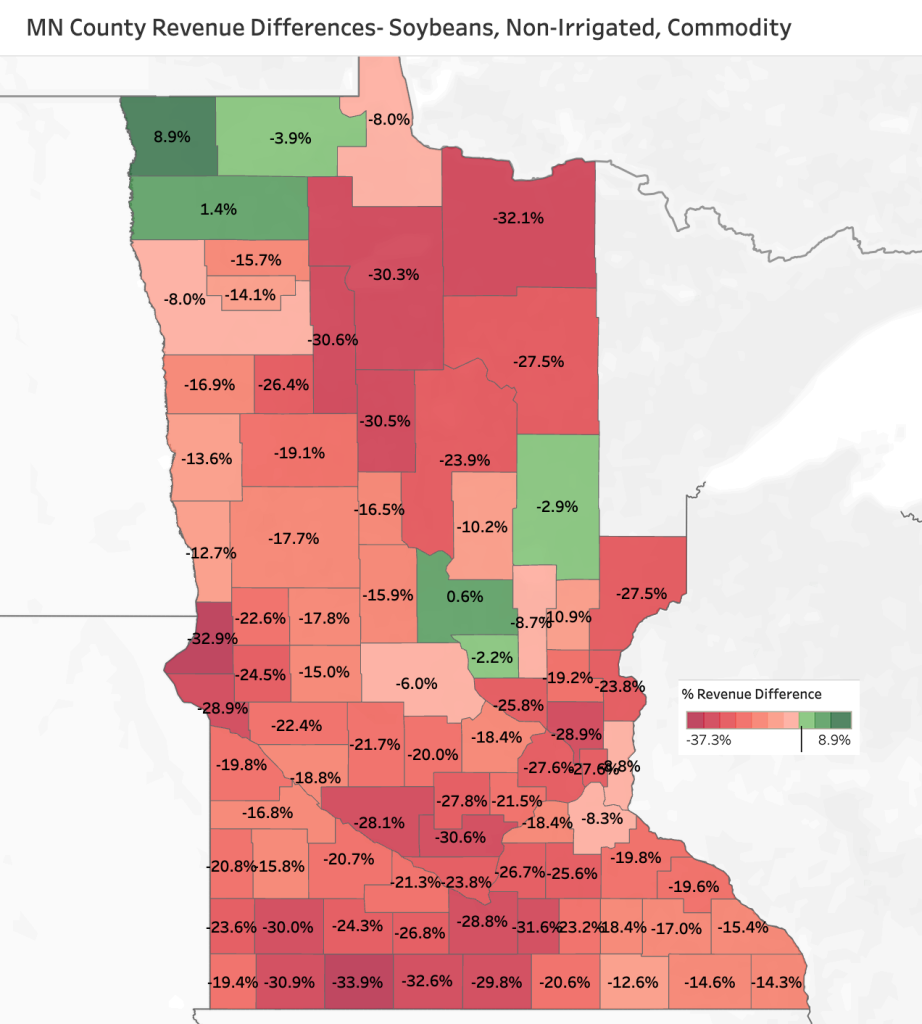
The maps show strong yield and revenue performance in the northern counties for both corn and soybeans, while the southern half of the state faced significant shortfalls, especially for soybeans. Central Minnesota had more mixed results but generally fared better than the south.
What This Means for You
These maps are for general understanding only and do not predict specific indemnity payments for any individual policy. PRM will automatically notify customers if an indemnity is owed. No loss adjuster is needed to determine an indemnity payment.
If you have questions or want help reviewing your specific county results and coverage details, please reach out to your PRM Risk Management Advisor.
Data from RMA Information Reporting System. These maps are for illustrative purposes only. They do not replace your offcial policy documents or RMA reports and should not be used as a final guarantee of indemnity status. Not all coverage or products may be available in all jurisdictions. The description of coverage in this document is for informational purposes only. Actual coverage will vary based on the terms and conditions of the policy issued. The information described herein does not amend, or otherwise affect, the terms and conditions of any insurance policy issued by Clear Blue Insurance Company.


