Where Your Profitability Goes When Prices Drop $0.48
In today’s ag market, thin margins and volatile prices leave no room for guesswork. But what if the data you’re relying on to make key decisions about yield, breakeven, even crop insurance is skewed from the start?What if your yield and profit numbers are off not because of what you planted, but because of what you didn’t?
That’s what could happen when you rely on Common Land Unit (CLU) data alone. While CLU maps provide an FSA’s view of what should be planted, they don’t show what was actually planted. And when unplanted acres are included in your calculations, your yield, profit, and risk data all get distorted.
This is an example of a single field and how CLU vs. Precision acres change performance metrics at different corn prices. We’ll look at a field with many low-lying, unusable areas.
Key Takeaways
| Acres | Projected Price Profitability | Harvest Price Profitability | |
| CLU Method | 119.43 | $154.46/ac | $90.30/ac |
| Precision Method | 101.33 | $237.90/ac | $166.11/ac |
The CLU View: Defined Borders, Murky Reality
CLU data reflects what the FSA defines as potentially plantable ground. The problem? It includes every acre within the boundary whether it was planted or not. That means when you calculate average yield or profit per acre using CLU data, you’re averaging in zero-yield acres. It’s clean in an Excel table, but the metrics are misleading.
CLU- Spring Projected Price $4.70
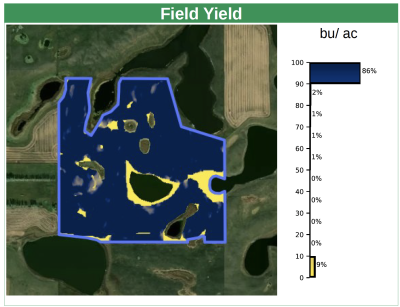
- Average Yield: 131.59 bu/ac
- Field Acreage: 119.43 ac
- ROI: 33%
- Profit: $154.46/ac
At first glance, this looks like a decent performance. But here’s the reality: not all 119 acres were planted. The profit and ROI metrics are artificially low because you’re assuming full coverage of seed, inputs, and revenue across acres that were never farmed. It dilutes the data and your ability to make confident decisions.
The Hidden Cost of CLU-Based Decisions
When you calculate profitability across unplanted acres, the example turns less favorable for your business outcomes. It can:
- Undervalue your real performance
- Mislead input ROI decisions
- Undermine your breakeven analysis
- Give a false sense of acceptable risk
These metrics worsen when you apply the Harvest Price of $4.22 to CLU based calculations.
- Average Yield: 131.59 bu/ac
- Field Acreage: 119.43 ac
- ROI: 19%
- Profit: $90.30/ac
Precision Acres Reveal True Field Performance
Now let’s look at the same field. Only this time, measured using actual planted and harvested data through precision technology. At the start of the season, with higher corn prices, the field looks great.
Precision Acres – Spring Projected Price $4.70
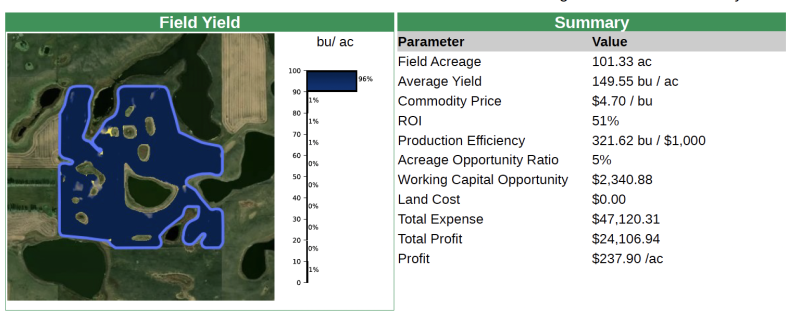
This is the field as it was actually planted with no assumptions. The profit per acre and ROI are significantly higher because you’re finally looking at real data. Precision data removes assumptions and guesswork farmers are forced to make using CLUs. Using this method gives you decision-ready insights that are based on your extremely precise data.
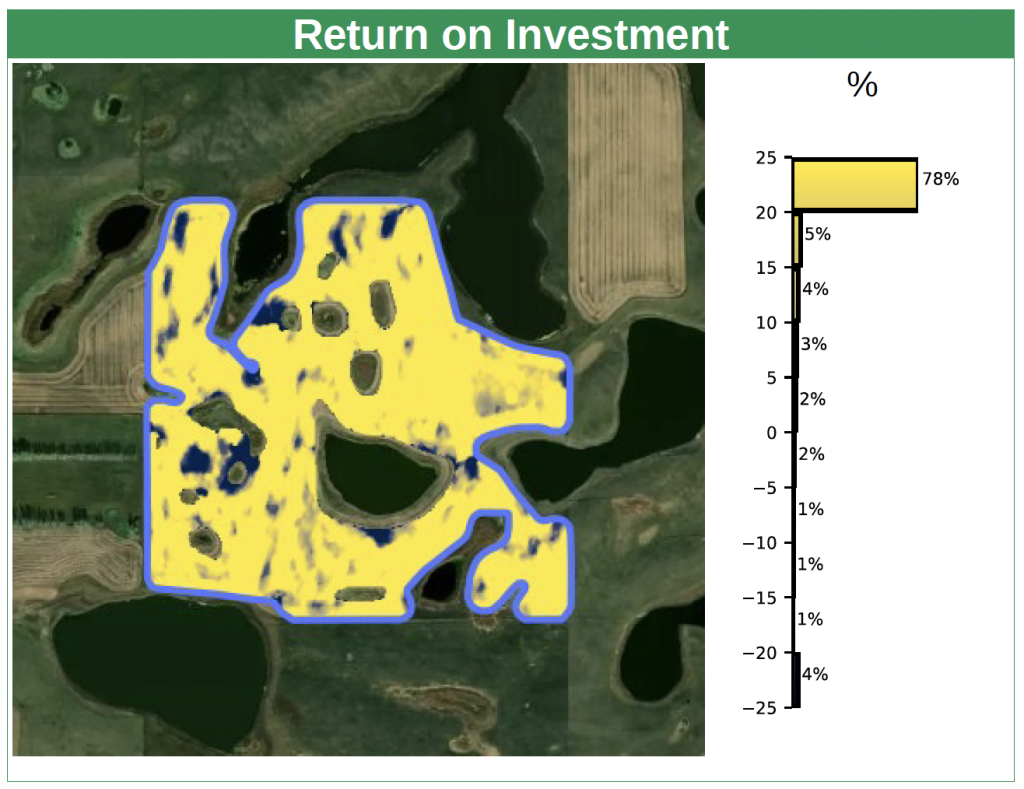
Harvest Price Swings
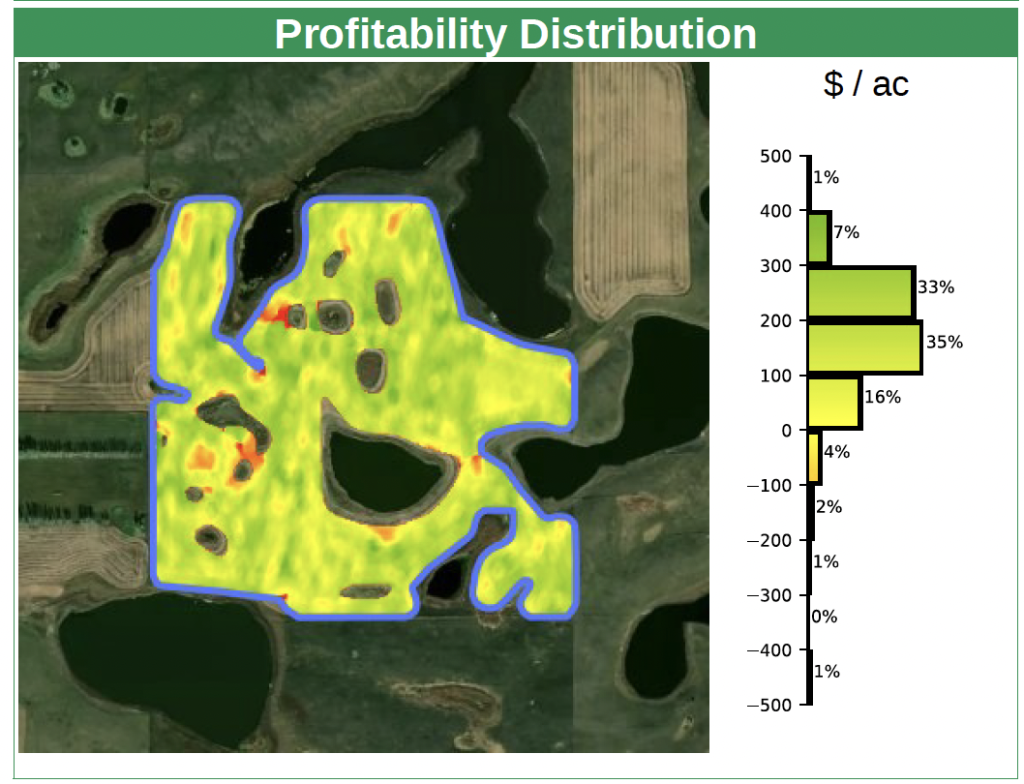
In 2025, we saw a significant price swing from Spring to Fall of $0.48. Any farmer will tell you prices will have a huge impact on profitability. With precision data, we can examine not only the top-line metrics, but we can also see exactly where fields are losing money.
Precision Acres – Harvest Price $4.20
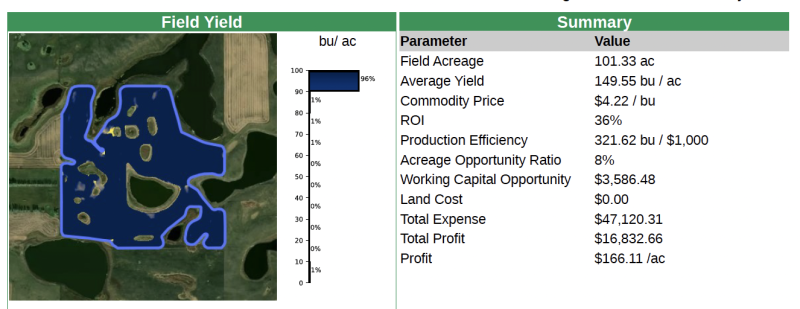
Spring vs Harvest Comparison
| Spring | Harvest | |
| Yield | 149.55/bu | 149.55/bu |
| Price | $4.70 | $4.22 |
| ROI | 51% | 36% |
| Working Capital Opp | $2,340.00 | $3,586.48 |
| Profit | $237.90 | $166.11 |
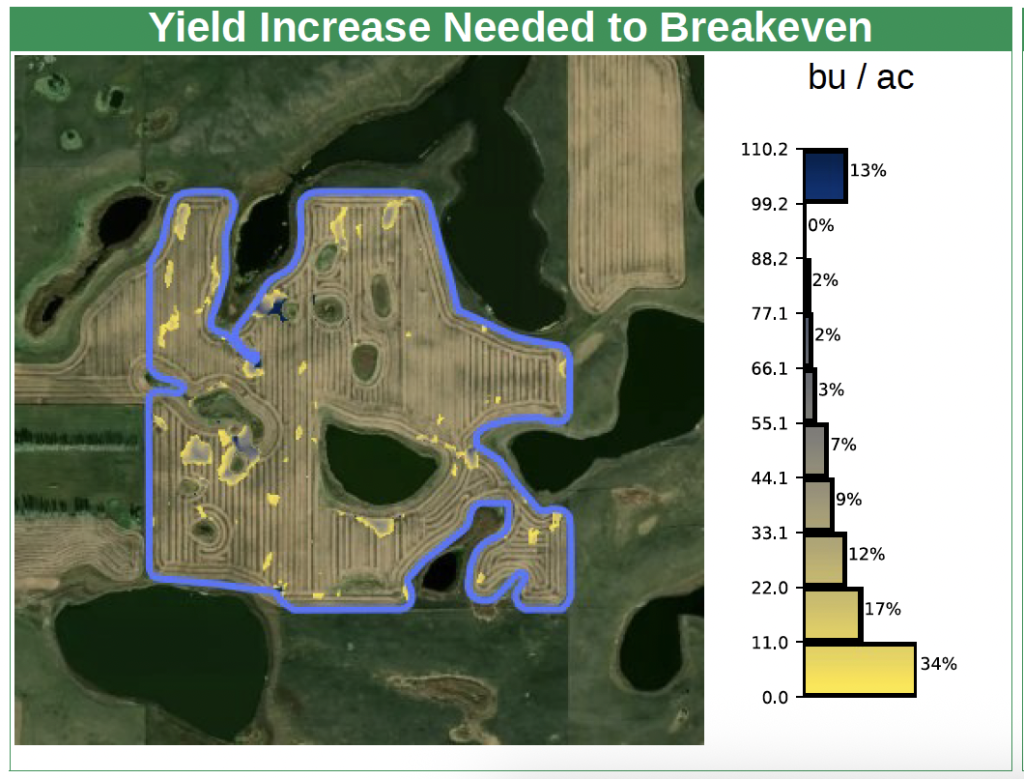
We can see a huge swing in profitability. With precision acres, we dig deep into each part of the field of where we are now losing profit. The two maps below show where there is a negative return and how much yield would need to increase to breakeven. Many of these areas are around the unplanted, low, and wet areas. With this knowledge, it may be worth considering expanding the unplanted areas for next year if prices stay low.
Comparing CLU Harvest Price to Precision Harvest Price
The real test of any data set comes when the market shifts. When we introduce the harvest price, the gap between CLU and precision only grows wider.
- CLU Profit: $90.30/ac
- Precision Profit: $166.11/ac
What you see is how the inclusion of unplanted acres in the CLU approach distorts your ability to understand field profit sensitivity to commodity price changes. The only way to get accurate insights is to use precision data.
Making the Switch to Precision is Essential
This isn’t just a tech upgrade. It’s a strategy shift. Precision data:
- Gives accurate acre reporting
- Simplifies crop insurance reporting
- Identifies underperforming zones
- Protects profitability
- Aligns insurance with real risk
In ag, where a drop in commodity price can flip a field from profit to loss, you can’t afford to operate from assumptions. Precision gives you field-specific visibility into yield, ROI, and sensitivity to price. These are key things every farmer needs to know to make decisions with confidence.
Rethink Your Next Crop Plan
Before you plan another year based on CLUs, it might be time to make the switch to precision. Precision Risk Management elevates your risk management plan by setting up and putting your precision data into action to help fuel your profitability. PRM will:
- Incorporate precision into your crop insurance analysis to create a better risk management plan
- Evaluate risk and return in each field
- Adjust coverage, inputs, and strategies to match your data
You are likely already collecting the data. Now it’s time to use it. Talk to a Risk Management Advisor today to learn how we can help.

