
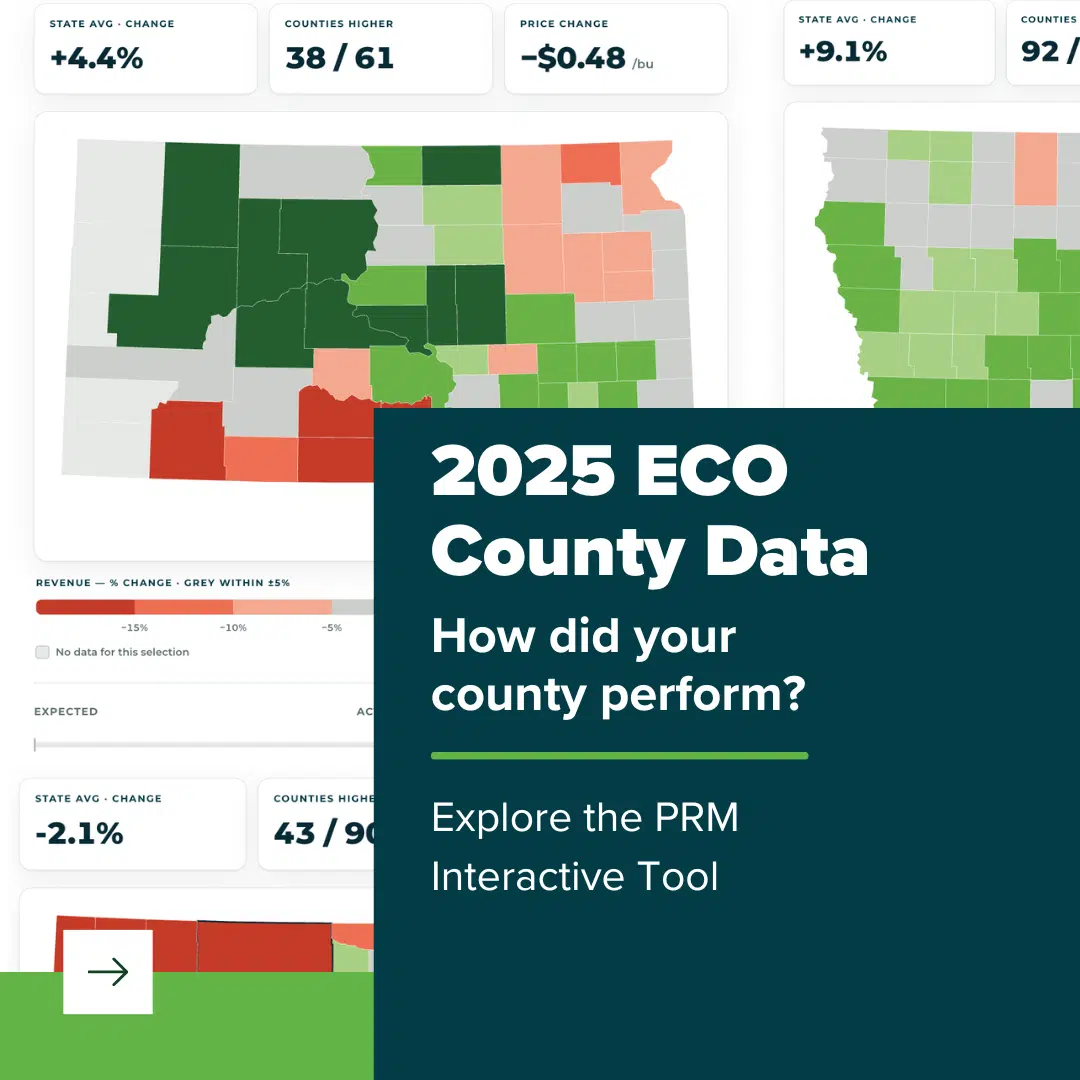
See How Your County Performed
The Risk Management Agency (RMA) has released the final county yields and revenues that determine how Enhanced Coverage Option (ECO) performed for crop year 2025. Because ECO relies on collected production data after harvest, there is always a short lag before final numbers are published. PRM has compiled these figures into maps to help you understand how ECO generally performed in your area with county yields and revenues.
How ECO Works
ECO is an area-based policy option that protects against drops in county-level yields or commodity price. A loss payment for ECO will be owed when the actual county revenue falls below the county revenue guarantee. This guarantee is determined by the expected county yield and the expected commodity price. If your county’s actual revenue falls below your selected coverage level, 90–95%, an indemnity may be triggered automatically.
How Prices Affect County Revenue
Revenue coverage depends not just on yields, but also on the price at harvest. For 2025, both corn and soybean prices came in lower than the projected price established during the Price Discovery Period in the spring:
- Corn: Projected price was $4.70 with a Harvest Price of $4.22
- Soybeans: Projected price was $10.54 with a Harvest Price of $10.35
State Analysis
We will take a look at the state trends of the most common crops, types, and practices in each state.
Corn: grain, non-irrigated. Soybeans: commodity, non-irrigated.
Illinois
For Illinois, the maps reveal a stark north-south divide. Corn revenue fell short across nearly the entire state, but the deepest shortfalls were concentrated in far southern Illinois — Franklin, Williamson, Hardin, Pope, and Johnson all came in 40–50% below expected revenue. Only the northeastern counties around Cook, Lake, and Kankakee finished close to expectations.
Soybeans followed the same geography but with a brighter north. Northern and northeastern counties — Cook, Lake, Kankakee, Iroquois, and Will — held above expectations, while the southern counties of Franklin, Williamson, Pope, Marion, and Perry again posted the steepest declines. Across both crops, southern Illinois was the clear weak spot in 2025, with the northern half of the state holding revenues nearest to, or above, what was expected.
Iowa
For Iowa, the maps show corn revenue shortfalls concentrated across the northern and central counties, where final results landed below expectations. Hancock, Wright, Kossuth, Marshall, and Pottawattamie were among the hardest hit. Southern Iowa held up best, with Lucas, Van Buren, Davis, and Clarke finishing at or above projected revenue.
Soybeans told a much stronger story statewide. Nearly every county came in above expectations, led by the southern area of Van Buren, Lucas, Clarke, Davis, and Monroe. Only a handful of far-northern counties — Kossuth, Winnebago, and Hancock — slipped slightly below. The pattern holds across both crops. Northern Iowa carried the season’s shortfalls, while central and southern counties saw final yields strong enough to keep revenues near or above expectations.
Kentucky
For Kentucky, corn and soybean revenues came in below expectations across almost every county. In corn, the deepest shortfalls ran through central and south-central Kentucky — Marion, Lincoln, Taylor, Adair, Casey, and Green. Soybeans followed a similar map.
Minnesota
For Minnesota, the maps point to the west-central counties as the season’s weak spot. In corn, Kandiyohi, Big Stone, Chippewa, Pope, and Stevens posted the largest revenue shortfalls. Northern Minnesota performed very well. Cass, Crow Wing, Aitkin, Hubbard, and Roseau finished well above expectations.
Soybeans followed nearly the same map. The same west-central cluster of Stevens, Big Stone, Pope, Kandiyohi, and Chippewa again fell short. The north and east — Aitkin, Kanabec, Benton, and Morrison — held well above projected revenue.
Nebraska
For Nebraska, the maps show corn revenue splitting sharply across the western half of the state. The northwest and Panhandle — Scotts Bluff, Box Butte, Sioux, and Dawes — fell well short of expected revenue. While southwestern counties surged. Hayes, Dundy, Chase, and Perkins finished 40–50% above expectations.
Soybeans came in stronger almost everywhere, with the biggest gains again in the southwest, Perkins, Lincoln, McPherson, and Chase. Only a scattered few counties, such as Harlan, Hayes, and Furnas finished below revenue projections. The clearest takeaway is the Western contrast. The northwest Panhandle carried corn’s shortfalls, while southwestern Nebraska posted the state’s strongest results in both crops.
North Dakota
For North Dakota, corn and soybeans diverged across the state. In corn, the western and southwestern counties — Stark, Slope, Hettinger, and Mountrail — saw revenues fall below expectations. The south-central counties held up best, with Sioux, Emmons, Kidder, and McIntosh finishing above projected levels.
Soybeans flipped the geography. The east-central counties of Foster, Barnes, Stutsman, Steele, and Griggs posted the steepest drops in revenue. Western North Dakota delivered the strongest gains, led by Burke, Mercer, Hettinger, Stark, and Dunn. An interesting development, several western counties that lagged in corn ranked among the best in soybeans, such as Stark.
South Dakota
For South Dakota, the maps show corn and soybean revenue shortfalls concentrated in different regions of the state. In corn, the south-central and southwestern counties — Oglala Lakota, Todd, Mellette, Tripp, and Gregory — saw final yields fall well short of expectations and revenues drop sharply. Much of central and eastern South Dakota finished at or above what was projected.
For soybeans, the weaker results clustered in the northeast — Marshall, Brown, Codington, and Spink. The south and southeast, including Yankton, Hutchinson, and Bon Homme, held above expectations. Across most of the state, stronger-than-expected final yields kept county revenues near or above projected levels, with the widest shortfalls limited to those few outlying regions.
Tennessee
For Tennessee, the maps show widespread revenue shortfalls in both crops. For corn, the eastern counties saw the largest declines — Pickett, Scott, Morgan, Fentress, Claiborne, and Overton. While the north-central counties around Stewart, Robertson, and Montgomery held closest to expectations.
What This Means for You
These maps are for general understanding only and do not predict specific indemnity payments for any individual policy. PRM will automatically notify customers if an indemnity is owed. No loss adjuster is needed to determine an ECO indemnity payment, as it is an area based plan. If you have questions or want help reviewing your specific county results and coverage details, please reach out to your PRM Risk Management Advisor.
Data from RMA Information Reporting System. These maps are for illustrative purposes only. They do not replace your official policy documents or RMA reports and should not be used as a final guarantee of indemnity status.