 |
|---|
By Guillermo Balboa – Nutrient Management and Digital Agriculture, Joe Luck – Extension Precision Agriculture Engineer, Laila Puntel – Extension Soil Fertility and Precision Ag Specialist, Pablo Paccioretti – Post doctoral associate, University of Nebraska
Lincoln, NE — This CropWatch article is part of the digital agriculture series (DA), “How Digital is Agriculture in Nebraska?” If you missed our first articles, you can check them on the links provided at the end of this article.
The Digital Farming Lab, led by Dr. Guillermo Balboa, conducted a statewide survey to assess the status of DA in Nebraska. For more resources about DA in Nebraska, visit our UNL Digital Agriculture website, which aims to centralize all UNL efforts in teaching, research and extension on digital afgriculture.
We want to start by refreshing the concept of digital agriculture. Digital agriculture (DA) can be defined as the use of new technologies, combining multiple data sources and advanced analytical methods, and integrating systems that allow farmers and stakeholders of the agricultural value chain to improve the food production system. Digital agriculture includes the Internet of Things (IoT), precision agriculture, blockchain, big data, digital platforms and artificial intelligence.
The first article in the series introduced the survey, defined digital agriculture and how farmers perceive it, and summarized 10 facts about DA in Nebraska (10 facts flyer). To read the first article click here.
Our second article highlighted the level of adoption of 33 different technologies in the state of Nebraska. This third article presents the barriers identified for the adoption of DA tools.
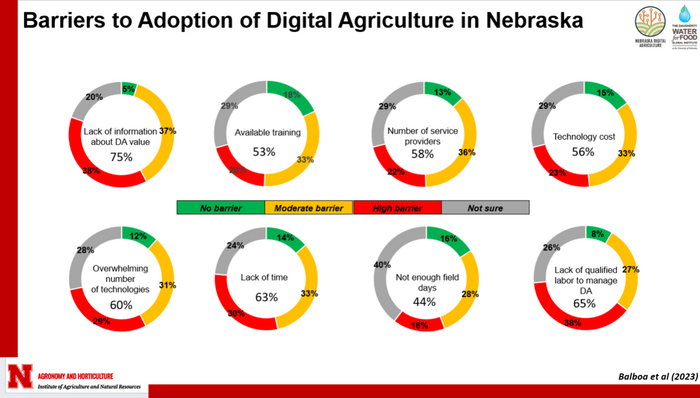
Farmers were asked about different levels of barriers to the adoption of digital agriculture. They categorized them as no barriers, moderate barriers, high barriers or just not sure category (Figure 1). The ranking combining high and moderate barriers is:
*Lack of information about digital agriculture value: 75%
*Lack of qualified labor to manage digital agriculture: 65%
*Lack of time: 63%
*Overwhelming number of technologies: 60%
*Number of service providers: 58%
*Technology cost: 56%
*Available training: 53%
*Not enough field days 44%
To read the entire article click here.