By: Lucy Sledge
Perhaps you’ve heard that 2025 is the year of a “Big Drought” for the Midwest, but is that weather truth or folklore? Before you start to make farm planning choices for 2025 based on folklore, it is a good idea to understand what is fact-based and what is not. I took a look at multiple weather and solar cycles sparking the discussion to see if there is any truth to claims of extreme drought in 2025.
What’s Behind The Big Drought Idea?
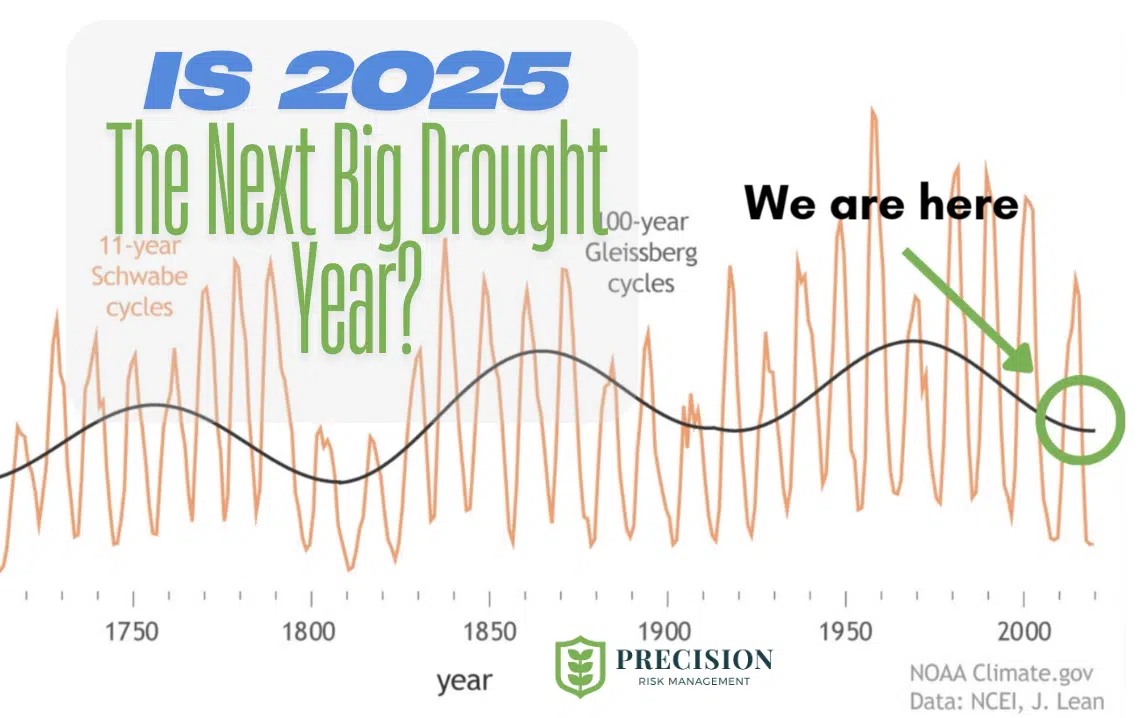
The theory behind 2025 as a big drought year for the Midwest is built off a sun cycle known as the “Gleissberg Cycle”.
- grouping of 11 year solar cycles, roughly 2-3 relatively strong cycles will be preceded and followed by 2-3 relatively weak ones
- Cycles can be as short as 66 years but on-average are 100 years long
- Historical cycles determined by studying carbon in tree ring data
- Last 3 Cycles are: 1700-1810, 1810-1910, and 1910-2010
- We are currently about 15 years into a Gleissberg Cycle now.

Why it Matters:
Periods of increased solar activity and radiation could lead to more evaporation. During years with little precipitation, this can worsen drought conditions, but it isn’t a “sole” cause of drought.
To predict 2025’s potential impacts from the Gleissberg cycles we need to compare this year (15 years into the cycle) to comparable years in previous cycles: 1925, 1825 and 1715. Reliable climate data goes back to the 1950s, but we are able to use paleoclimatology, studying tree rings and ocean sediments to reconstruct past climate conditions before instruments and people measured soil and temperature conditions reliability in the Midwest.
The Data Behind It:
1715 Drought Conditions:
- According to tree-ring data, there was no drought in the Midwest and High Plains in 1725
- conditions were abnormally wet with no drought in sight
- Extreme drought did return to the region in 1718, 1736 and 1757, 1771 and 1792
- Extreme drought occurred roughly every 20 years during the 1700s

1825 Drought Conditions:
- Pockets of abnormally dry conditions in Iowa and South Dakota, but no widespread drought
- Plains were coming out of an extreme drought in 1818, rather than going into one (like in 1715)
- Severe and Extreme drought occurred in 1848, 1865 and 1895
- During the Gleissberg Cycle of 1810 -1910 there were 4 severe to extreme drought spells that impacted the Midwest and High Plains.

1925 Drought Conditions:
- Additional drought dataset available based off supply & demand reconstruction, not tree rings
- Moderate to severe drought conditions in Missouri, Illinois and Iowa
- Large discrepancies between the two types of drought datasets highlight imperfect nature of tree ring data to reconstruct historical drought

The graphic on the left utilizes the same drought tool as the previous years discussed above. The graph on the right is an additional drought dataset available starting in the late 1800s, providing additional drought information on a rolling 9-month period.
So what conclusions can we draw by comparing the last 100 year cycles? First, there is no clear pattern of drought conditions happening at year 15 in the Gleissberg cycle. Second, tree ring data is not a perfect science, and therefore historic drought outlooks are imperfect as well and don’t provide the full picture.
Another Angle
So we’ve debunked that there isn’t a drought every 100 years based on the Gleissberg cycle. So what about the 89-year timeline you may have heard elsewhere and the major droughts of 1936 and 1847? First, according to historic climate data there was no extreme drought in 1847, but there was in 1848. Comparing two years with extreme drought is a match, not a pattern.
To add more depth to this 89 year cycle, we need to compare it to a third year of 1758. In 1758 drought conditions were starting to worsen in the Dakotas with no drought elsewhere according to tree ring data.


Since our last “mega-drought” in 1936 we’ve seen extreme drought in the Plains many times: 1953, 1976, 1988, 2003, 2006 and 2012/2013. The historical drought of 1936 was comparable to the drought of 2012/13 and 2021 in the Western U.S. and the High Plains. I think it’s safe to say, regardless if we’re looking at an 89 year or 100 year cycle, there is no clear pattern of drought based on solar cycles.
Big Picture
More impactful to drought conditions are shorter-term patterns, and one of the most well known is the El Nino/La Nina pattern.
- Currently we are experiencing a La Nina pattern
- usually leads to drier and colder conditions favoring the High Plains, with wetter conditions for the Ohio River Valley and mid-Mississippi River Valley
- La Nina pattern is expected to continue through the rest of the Winter and Spring months become less pronounced this summer
- Long term seasonal outlooks from the Climate Prediction Center indicate below average rainfall through the late Spring and early Summer
- Average temperatures expected through the summer months
Impacts to Farmers in 2025:
As a result of a relatively dry fall and less than meaningful winter precipitation, there are pockets of extreme drought (level 3 out of 4) in the western Dakotas. The Central and Eastern Dakotas are experiencing severe drought (level 2 out of 4) with abnormally dry conditions (level 1 out of 4) for many other parts of the region. In southern Illinois and Missouri there are no drought conditions.
With below average rainfall and average temperatures, drought conditions in the Dakotas are not anticipated to improve through the spring and summer. In fact, there could be an expansion of the extreme and possibly exceptional drought conditions. Meanwhile in Minnesota, Illinois and Missouri there is the opportunity for abnormally dry conditions to expand with average rainfall anticipated through the spring, not above average to alleviate dry conditions currently being experienced.
Key Takeaways
There are a couple problems with directly comparing future drought to that of previous years:
- comparing historical drought between two years is a match, not an indication of a pattern
- when we widen the view, we find that there is no clear pattern of drought based on a solar cycle (89 or 100 years in length)
- historic drought data (based on tree rings) is imperfect before modern, standard measurements we see today
It is much more accurate to look at shorter time-scale weather patterns such as the La Nina/El Nino patterns. For farmers in the Midwest this will mean continuing dry conditions, especially in the Dakotas, with any chance of above-average precipitation concentrated into the Ohio and mid-Mississippi River Valley.
We’ve had our pockets of extreme and exceptional drought every year since 2021, falling in the late summer and continuing through the Fall before winter precipitation rights us headed into the Spring. With long-range forecasts in mind of average to below precipitation and average temperatures, drought conditions will continue where we experience them currently and potentially worsen in the regions already experiencing the worst of the drought (Dakotas, western Iowa).
Precision Risk Management is an equal opportunity provider. This is not a recommendation for any products or services. Talk to a Risk Management Advisor for any recommendations. Go to PrecisionRiskManagement.com/legal for all disclosures and compliance.

