
Trends to Track
Weather can have a significant impact on the success of crops, and every farmer knows the devastating effects of a hailstorm over an operation. Hailstones can range in size from small pellets to grapefruits, and they can fall at high speeds from the sky, pummeling fields and destroying crops in a matter of minutes. For farmers, hail can be a devastating event that can wipe out entire harvests. In this article, Meteorologist Lucy Bergemann and PRM explore the frequency and severity of hail in your state. Are we seeing more hail? Is it more severe? Is hail becoming less of a risk to an operation?
Key Takeaways
- We have seen a downturn in the number of 1” hail reports throughout the majority of the region.
- Despite the decrease in smaller hail reports, we have seen no notable change in the largest hail reports (2”+) over the last 10 years.
- There has been a general decrease in the number of severe hail days in the last 10 years for much of the region.
Hail reports are categorized as “severe” when they are larger than 1” in diameter. I’ve looked at the trends in the last 10 years to determine if there has been any trend in the number of severe hail reports. I’ve broken it down into three categories: 2”+ hail reports, 1.5”-2” hail reports and finally 1” – 1.5” hail reports. For simplicity, anything that falls in-between is rounded down (ie 1.75” hail report counts as 1.5”). Let’s jump into the numbers.
MISSOURI
The last 10 years have followed a bit of a bell through Missouri, peaking in 2017 and then have trended down since then. 2017 was an anomaly in the number of hail reports across all three categories of hail size. Interestingly, our most number of days with 1” and 1.5” hail reports was in 2019 with nearly 50 days of severe hail reports. What this means is that over fewer days, 2017 had more hail per day compared to 2019.

ILLINOIS
Similar to Missouri, there has been a decline in the number of hail reports per year over the last 10 years. Our last spike in the number of 2” reports was in 2017 and since then every year has been trending down (outside of 2020). 2020 had the most number of reports per day compared to any year of the last 10. So while 2017 featured the most number of hail reports, for every severe weather day in 2020 we saw more hail compared to 2017.

IOWA
Following the trend of MO and IL, Iowa also saw a busy hail year in 2017 and a decrease since that point in the 1” hail report category. There has been hardly any change for the number of 1.5” and 2” hail reports in the last 10 years. 2014 and 2017 were our most active hail years by far – with the most number of reports and days with severe hail.

NORTH DAKOTA
There has been a small decline in the number of 1” hail reports in North Dakota over the last 10 years with no major change or trend for the 1.5” or 2” hail reports. We had more severe hail reports per day in 2021 compared to any other year (2” and 1.5” hail). So while 2021 may not have had the most severe weather days, days with hail were generally more active.

SOUTH DAKOTA
Our most active year for all sizes of hail was 2020, followed closely by 2013. 2020 was a big spike in the amount of severe hail in all categories. 2020 was active for 2” reports with 79 total. Four of the last five years have seen above-average numbers for 2” hail.


MINNESOTA
There has been a significant increase in the number of 1” hail reports in Minnesota over the last 10 years with a smaller increase as well in the 1.5” reports. This is the most significant increase of any state in our region but can be partially attributed to an active year in 2022. 2022 had the most hail reports across the board and the most number of hail report days per category. In 4 of the last 5 years we have seen an above average number of 2” hail reports (all except 2018). What we are noticing is that 2022 brought the most number of severe hail days statewide, especially for 2” reports, meaning the frequency of the severe weather days could potentially be increasing.

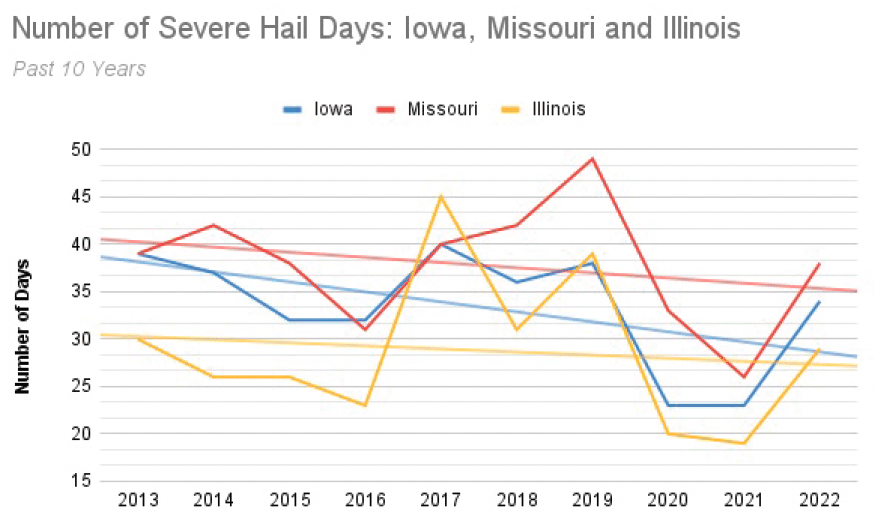
DAYS WITH SEVERE HAIL REPORTS
I also plotted the number of days per year with severe weather reports through the Midwest and into the High Plains. There has been a decrease in the number of severe hail days Iowa, Missouri and Illinois.
Across the High Plains we have seen a decrease in the number of severe hail days in South Dakota over the last 10 years with an increase in the number of days in North Dakota and Minnesota.

CONCLUSION
Taking all this information together tells us that we may be seeing a decrease in the number of hail reports per year and number of severe hail days through the Midwest (IA, IL, MO) but more days with severe hail and more reports especially into Minnesota.
For every state (outside of Minnesota) there has been no change or decrease in the number of 1” hail reports. We have seen no major trends in 2” hail reports, suggesting that large hail continues to be a primary threat in our region.
These reports are statewide and depend on weather spotters to report the hail to the national weather service. These numbers are likely an undercount of the true number of 1” – 2” + hail reports statewide, but show the general trends of said reports. What this data does not account for is where a storm strikes -if it is more of a population center, that more reports will naturally follow given the number of people. Still, what the data shows us is that there are no big changes in the last 10 years for the amount of severe hail that can damage your property (1.5 – 2+) and it is important to protect against the next big event.
Precision Risk Management content is only for your general information and use and is not intended to address your particular requirements. In particular, Precision Risk Management content does not constitute any form of advice, recommendation, representation, endorsement or arrangement by Precision Risk Management. Your use of the web pages provided by Precision Risk Management is at your sole risk. The web site and all data contained within it are provided on as ‘as is’ and ‘as available’ basis and services and data maybe withdrawn at any time and without notice. Precision Risk Management does not provide any warranties of any kind. We will not be liable to you for loss of actual or anticipated profits or savings, loss of business, loss of opportunity, loss or spoiling of data, loss of contracts, or for any indirect or consequential loss, whether arising from negligence, or breach of contract, or in any other way, even if we were advised of, or knew of the likelihood of, that loss or type of loss arising. Any information on Precision Risk Management that is categorized as “current” or “real time” may not be out of date by the time you access it and the data is not validated for accuracy.


