Is “Average” Changing in Your Area in South Dakota? South Dakota Precipitation Trends Are Changing
By Lucy Sledge
Ranchers’ operations can be drastically affected by weather conditions and there is nothing we can do to change the weather. We can only change how we react and prepare for what conditions are thrown at us.
One great risk management tool is Pasture Rangeland, Forage (PRF) Insurance which provides loss payments when the area has a below average precipitation. When this insurance tool’s triggering factor is pegged to an average, it is vital to know if precipitation trends are changing in your area.
Are conditions getting drier in the central part of the country? Is there a higher likelihood of below-average rainfall or snowfall for certain months? When deciding on Pasture, Rangeland, and Forage (PRF) insurance it is important to know if there is a higher frequency of below-average precipitation and for which months.
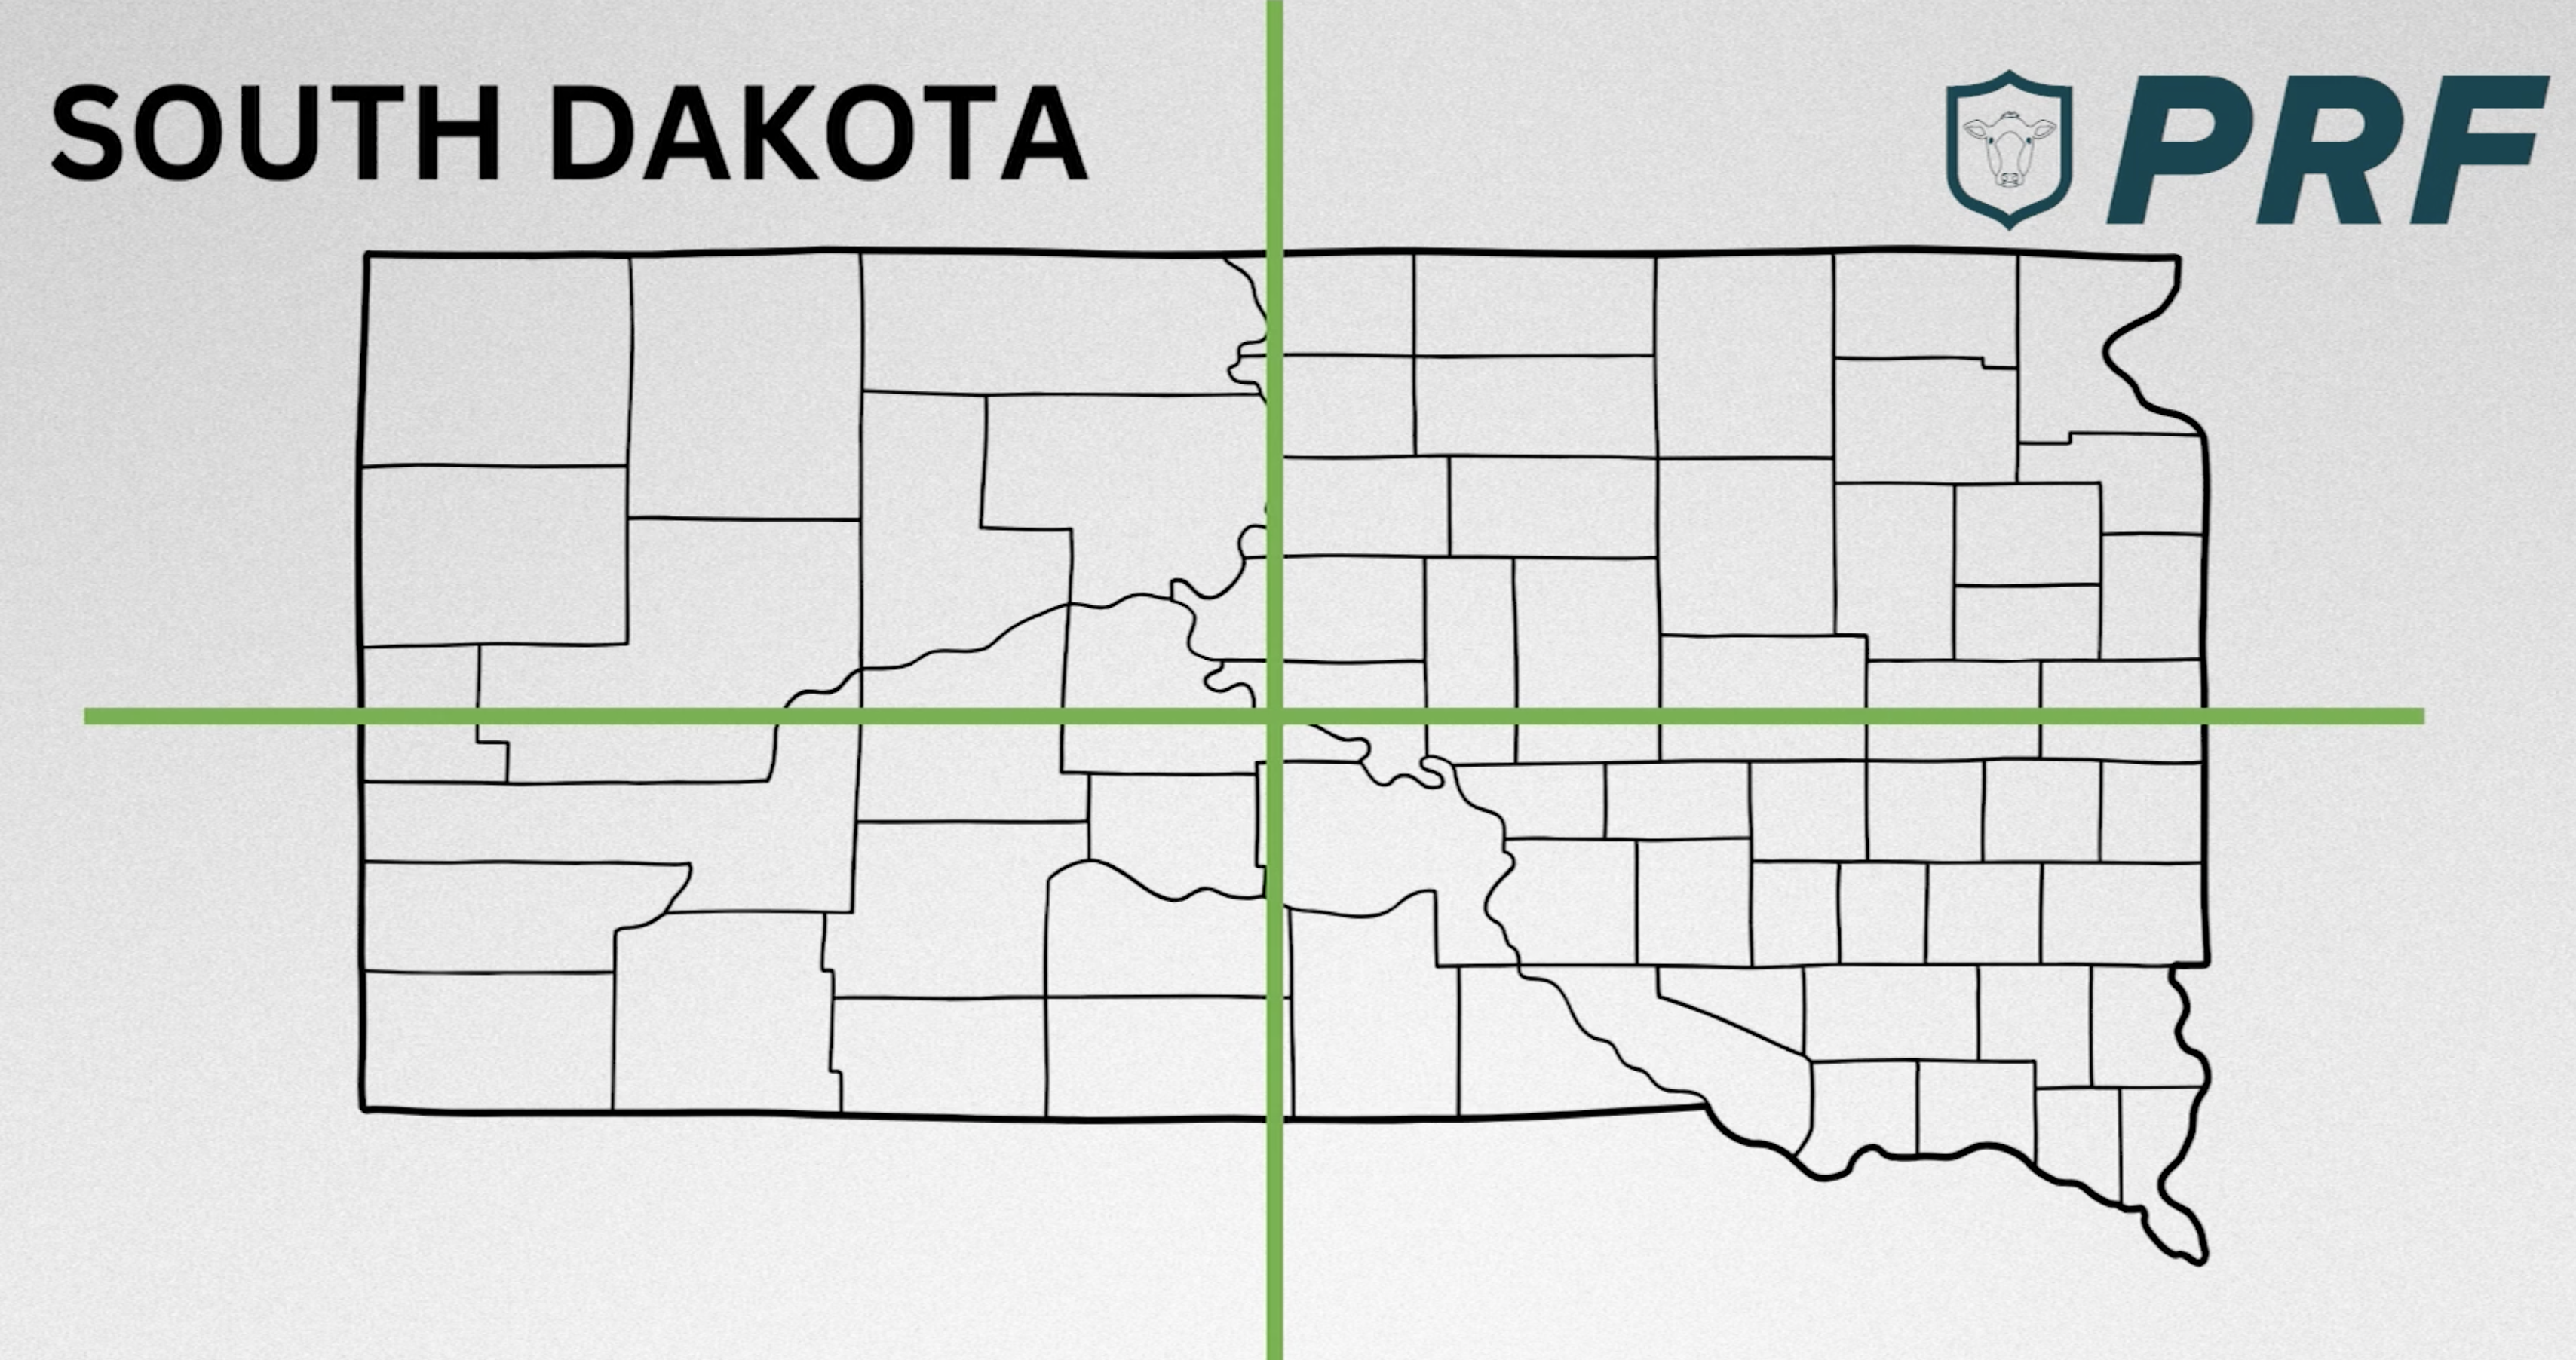
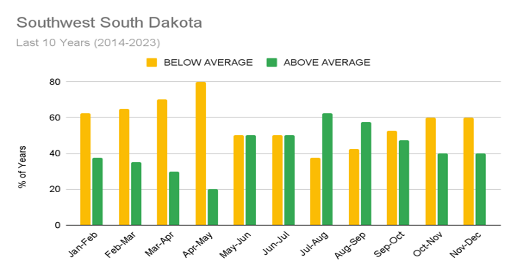
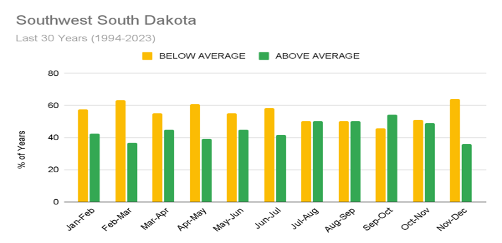
I looked at precipitation trends in Missouri, North Dakota, and South Dakota over 30-year and 10-year timescales, from 1994 and 2014, respectively. I used USDA PRF grid cell data for four grid cells from each region of the state (Northwest, Southwest, Northeast, and Southeast) and counted the number of above-average years versus below-average years. I did this for each of the 11 monthly ranges USDA provided and averaged the grid cells for the region to give us a general sense of trends.
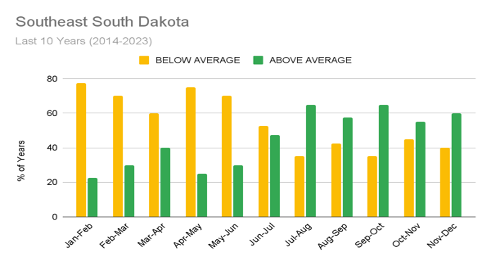
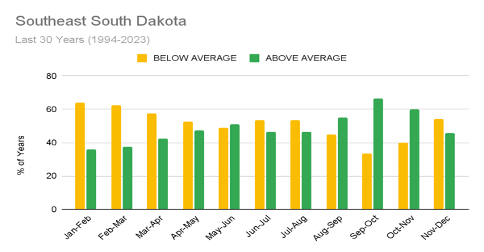
For simplicity, I then turned the “counts” of below versus above average into percentages to directly compare 10-year and 30-year frequency. You will notice that in the 10-year trends, there are non-even percentages; for example, 75% of July-August periods which would suggest 7.5 out of the last 10 years, and the uneven number is attributed to the averaging of multiple grid cells. Because PRF triggers not by the percentage by which we are below average just that we see less than 100% of average precipitation, I will talk about above or below average precipitation years in terms of frequency, not quantity at which they are above or below average.
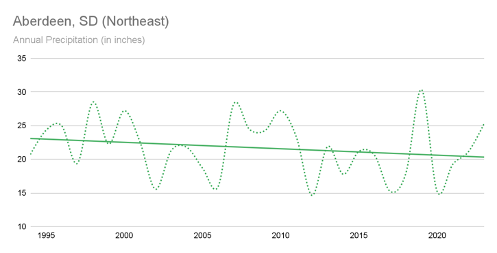
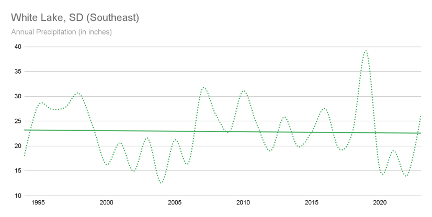
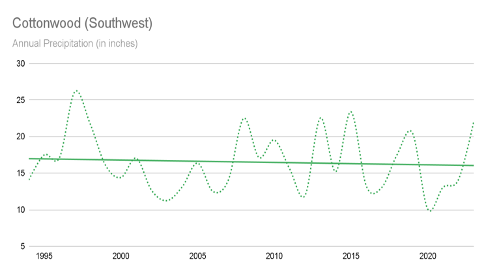
However, for context, I’ve selected a “representative” official National Weather Service reporting site for annual precipitation totals. In highlighting annual precipitation trends we can gain further insight into if years have been getting overall drier – i.e. those PRF below-average periods may be more drastic. In the graphs below, precipitation for each year over the last 30 years is displayed as a dotted line, and the solid line illustrates the trend.
Please note that the average precipitation is on rolling averages and may not directly line up with PRF Insurance precipitation triggers. These averages are also based on large regions of a state and do not correlate to any one specific grid. These averages should be used for context and not to decide coverages. Talk to a PRM Risk Management Advisor for interval selection recommendations.
NORTHWEST SOUTH DAKOTA
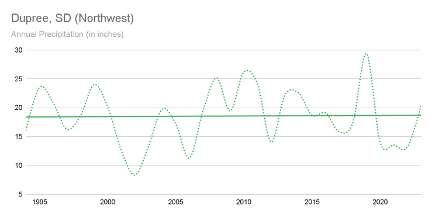
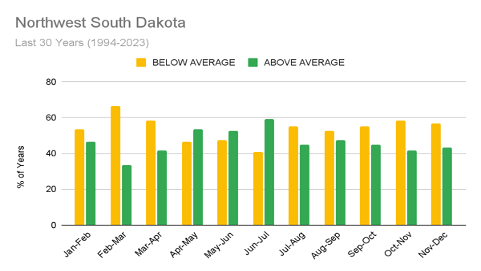
Over the last 30 years, there has been very little change to annual precipitation in northwest South Dakota, However, PRF grid data shows nearly every period saw a higher probability of below-average precipitation in the last decade compared to the 30-year average. A potential reason could be that though the frequency of below-average months is increasing, above-average months see more precipitation to offset more frequent dry conditions.
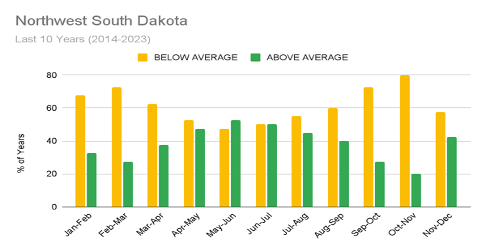
Our most likely months to be below average are September – November with 7 out of the last 10 years having below-average precipitation. Another frequent below-average period is February through April, reflected in the 30 and 10-year timeframes. The largest change is in January – February precipitation which has a slightly higher likelihood in the last 10 years (60%) compared to 30 years (50%). Our most likely potential of below-average precipitation is from Fall through early Spring in northwest South Dakota.
NORTHEAST SOUTH DAKOTA
Aberdeen, SD has seen a decrease in annual precipitation over the last 30 years of roughly 4”. Similar to the rest of the state, our highest frequency of below-average conditions from winter through early summer.
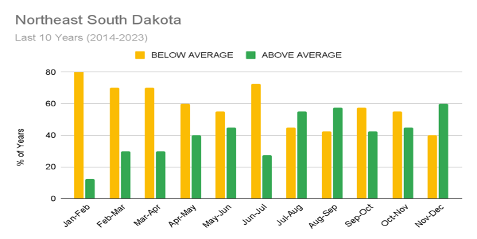
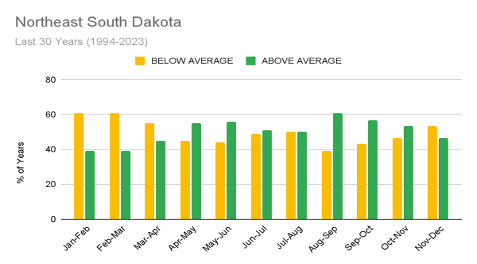
A closer look at PRF grid data illustrates that every single period has had more below-average years than above over the last decade. Every single year since 2014 has been below average for the February – March period with eight of ten years below average from November to February. Comparing the 30-year averages to the 10-year averages there is a higher likelihood of drier-than-average conditions from April through August and again from September to October, occurring more than 50% of the time. Though our highest likelihood of seeing below-average precipitation is from November to April there is an increasing frequency of below-average precipitation during much of the year now too.
SOUTHEAST SOUTH DAKOTA
In southeast South Dakota, there has been a very minimal change to annual precipitation in the last 30 years with a spike in yearly precipitation in 2019. This spike was seen statewide, although least extreme in Northwest South Dakota. Our most likely months to see above-average precipitation are July through December. The frequency of above-average conditions is increasing from July through November: 30-year trends show roughly 50-60% of years above-average and the last 10 years is closer to 60-65%.
On the flip side, there is a higher likelihood of below-average precipitation from January through June, and that likelihood has been increasing from roughly 60% over the last 10 years to more than 70% in the last 10 years. Our most likely months to see below-average precipitation are from January – June.
SOUTHWEST SOUTH DAKOTA
There has been a minimal decrease in annual precipitation in southwest South Dakota. Our recent wetter years were in 2019 and 2023.
The majority of the fall through early Spring months over the last 10 years have been below average for precipitation, most dramatically from April to May. There is an increased frequency of below-average precipitation periods over the last 10 years compared to the last 30. We have seen our largest changes in the last decade in September – October which were more likely to be wetter than average in 30-year trends but now are more likely to be drier than average. From July – September six of the last ten years have been above average for precipitation, which isn’t a huge change from the 30-year trends. Our most likely months to be below average are from November through April.
Conclusion
Parts of South Dakota have suffered from drier conditions since 1994. In western South Dakota, our most frequent below-average precipitation period is from Fall through early Spring. For the eastern part of the state, the shift is a couple of months to the right: from Winter through early Summer with an increasing frequency in the last 10 years of below-average precipitation from January to June.
So is it getting drier? For the Dakotas, annual precipitation has been trending downward over the last 30 years and the frequency of below-average periods is increasing. In Missouri, the answer isn’t that simple – while yearly precipitation may have increased slightly over three decades, monthly examination indicates an increasing frequency of below-average periods.
In many cases, the periods that displayed a higher frequency of below-average years since 1994 continue to display this in the last 10 years, and at a higher frequency too. The months that already tended to be below average continue to do so in the last decade. Furthermore, though we have seen some small increases in the frequency of wetter-than-average conditions, for many regions the number of wet periods versus dry has not drastically increased in the last 10 years.
Disclaimer: This report is not a recommendation or advice for crop insurance coverage. Talk to a licensed Risk Management Advisor for any policy recommendations. Precision Risk Management is an equal opportunity provider. Go to PrecisionRiskManagement.com/legal for all disclosures.

