Key Takeaways
Single Field Changes
-$5,868.56
Reduction of Total Expenses
+6.9%
Increase Return On Investment
+$663.40
Increase in Total Profit
Problem
Farming in the modern age is more complex than it has ever been. It sometimes feels like you need Excel spreadsheets more than a combine. The number of moving parts to a large operation is almost limitless. All those different parts have huge input costs, and profitability is king. It is no longer just about creating the best yields. A comprehensive analysis of an entire operation is needed to reduce risk and maximize profit.
A Precision Risk Management insured customer was farming a large number of fields with a high expense cost requiring a significant operating loan creating a large risk to the grower. The customer had respectable yields and total profit for each field. All the financial and agricultural metrics appeared acceptable, but the grower felt it was not the whole story, field-by-field. The PRM Risk Management Advisor and Data Specialist was called to perform an Acre Opportunity Analysis to diagnose the issue as part of their crop insurance policy.
Risk Management Advisor and Data Team
PRM transformed the role of the agent to be so much more than a salesperson. The Risk Management Advisor takes a holistic and tailored look at the grower’s operation to identify the specific needs. No two operations are the same and neither are the approaches PRM takes to manage risk. PRM’s Advisors are unique in the industry because of the resources of the PRM Data Team. Every policy is supported by a team of experts diving deep into the data to reduce their operation’s risk.
Process
In this case, the grower already utilized Precision Technology on all his equipment. This created a perfect opportunity to create an Acre Opportunity Analysis because the crop insurance reporting information for planting and harvesting was already organized. By using the field’s historical yield data, a 2021 Yield Potential Map was created and paired with the production costs to produce the following results.
The initial Acre Opportunity Analysis’s top-line numbers were great: $12,165 in total profit and $141.29 profit per acre. But by looking at the Acreage Opportunity Ratio, it’s identified 13% of the land in this field is not producing a profit and $5,124.80 is being spent without a return on investment.
| PARAMETER | VALUE |
|---|---|
| Field Acreage | 86.1 ac |
| Average Yield | 56.0 bu/ac |
| Commodity Price | $10.96 |
| ROI | 29.9% |
| Production Efficiency | 118.5 bu/$1,000 |
| Acreage Opportunity Ratio | 13% |
| Working Capital Opportunity | $5,124.80 |
| Land Cost | $200.00 |
| Total Expenses | $40,723.67 |
| Total Revenue | $52,889.01 |
| Total Profit | $12,165.34 |
| Profit | $141.29/ac |
With the Precision Technology data from crop insurance reporting, different maps were produced looking at subfield profitability showcasing hidden opportunities:


The Profitability Distribution shows the spectrum of positive and negative profit/acre, ranging from rounded values of +$500/acre to -$200/acre. The negative profit/acre is highlighted in the orange-colored zones. The Field Yield Map identified by the light red section with the lowest yield. It was significantly below the average yield produced on this field. The Profitability Distribution map shows that area of low yield was a loss for the grower to plant. Each time capital is put to seed and other inputs in that area, they lose money. The analysis then looked at what would be required to make the negative return areas profitable.


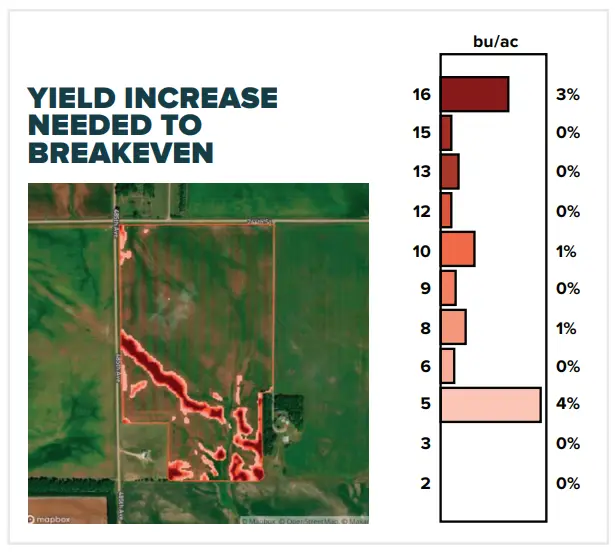
These two maps show the grower needs to increase yield ranging from 5 bushels/acre up to 16 bushels/acre or reduce expenses by $59/acre in areas up to $177/acre. The grower was already operating at what they believed was the most efficient and had no way to achieve those yield increases or expense reductions.
Solution and Results
Working with the grower to create the most efficient operation for crop insurance purposes, PRM and Pheasants Forever removed a marginal section of land across the field from production to place it in conservation program.


By not planting this section of the field, the new Profitability Distribution and Field Yield maps show significant improvements. Only 2% of the field is below profitability compared to 10%.
Solution and Results
The top line numbers were significantly improved as well:
| PARAMETER | VALUE |
|---|---|
| Field Acreage | 73.7 ac |
| Average Yield | 59.0 bu/ac |
| Commodity Price | $10.96 |
| ROI | 36.8% |
| Production Efficiency | 124.8 bu/$1,000 |
| Acreage Opportunity Ratio | 4% |
| Working Capital Opportunity | $1,333.96 |
| Land Cost | $200.00 |
| Total Expenses | $34,855.11 |
| Total Revenue | $47,683.85 |
| Total Profit | $12,828.74 |
| Profit | $174.08/ac |
| PARAMETER | VALUE |
|---|---|
| Field Acreage | 86.1 ac |
| Average Yield | 56.0 bu/ac |
| Commodity Price | $10.96 |
| ROI | 29.9% |
| Production Efficiency | 118.5 bu/$1,000 |
| Acreage Opportunity Ratio | 13% |
| Working Capital Opportunity | $5,124.80 |
| Land Cost | $200.00 |
| Total Expenses | $40,723.67 |
| Total Revenue | $52,889.01 |
| Total Profit | $12,165.34 |
| Profit | $141.29/ac |
| ACRES | YIELD | ROI | AOR | TOTAL PROFIT | PROFIT/ACRE | TOTAL EXPENSES |
|---|---|---|---|---|---|---|
| 86.1 | 56 | 29.9% | 13% | $12.165.34 | $141.29 | $40,723.67 |
| 73.7 | 59 | 36.8% | 4% | $12.828.74 | $174.08 | $34,855.11 |
| 12.4 | 3 | 6.9% | 9% | $663.40 | $32.79 | $5,868.56 |
By removing 12.4 acres from planting and harvesting, the return for the grower improved across all categories. The yield was improved by 3 BU/A with no farming practice changes. As time progresses, this yield improvement will increase the Actual Production History (APH) for crop insurance. The APH is the foundation of the policy affecting many aspects including total loss payout.
The operator is reducing the total premium paid for their crop insurance policy by reducing the total acres planted. This does reduce the total premium PRM is receiving, but it also removes the most likely areas to produce a loss. By removing the unprofitable acres, it is positive for all parties involved.
The largest benefit for the grower came in profit and expense reduction. By not planting in unprofitable areas, the total expenses were reduced by $5,868. Even with planting 12.4 acres less, the total profitability increased by $663 or $32.79 per acre. All of these factors add up to a 6.9% increased return on investment for the field. The grower also has a great presentation for his banker the next time he renews his operating loan.
Next Steps
Planting around unprofitable acres is not the end of the process even though the operator already saw an increase in profitability. Pheasants Forever employs Farm Bill Biologists and Precision Ag and Conservation Specialists to help evaluate and provide customized solutions for underperforming acres. The Farm Bill Biologist is now working with the grower to determine program options. Conservation Reserve Program (CRP) is only one example of possible programs the farm bill biologists have at their disposal. At the time of the initial visit with the grower, a CRP payment for the marginal ground on this field was $167/acre in additional revenue. Currently, the CRP program is going through some changes to payments and incentives that should make the program even more profitable to the grower. When these program changes are finalized, Pheasants Forever will work with the grower to assess how CRP can benefit their land and bottom line. Other programs are being explored to create a revenue opportunity in the unprofitable parts of the field.
The goal of PRM is to utilize precision technology to reduce risk and improve farm profitability by targeting the underperforming acres and putting those acres to work in a different way that is beneficial for soil health, water quality, wildlife habitat, and improving sustainability.
Price Increase Scenario
With recent crop price increases, the imposing thought of how will the higher market price affect the net negative areas in the farm? In this scenario, the crop price was changed to $13/bushel, the profitability distribution is shifted upwards, but there is still 8% of the land not returning a profit. Even with increasing commodity prices, there is still an opportunity for an in-depth analysis for cost savings.
Insured Reaction
“I loved this opportunity to create long-term habitat for pheasants and ducks and to increase our profit. Just by making a few land improvements, it made a crazy difference to the bottom line. I’m very excited to see the potential of these other federal programs to put the unplanted acres to good use and increase revenue even further.”
– Landowner
“If a farmer can put his undesirable acres into a program that will pay him and raise their yields on the rest of the field that’s a win, win. PRM and Pheasants Forever made the process easy and were able to answer any questions I had.”
– Operator
Conclusion
The PRM’s Acre Opportunity Analysis identified large opportunities for improvement on the field otherwise hidden. In just one field, profitability, yield, and ROI could all be improved. If the Acre Opportunity Analysis was performed across all fields in the operation, the financial impacts for the grower could be significant.

